Finding Emerging Strength During a Rotational Period

Key Takeaways
- Mega-cap growth names like META and MSFT are pulling back in August, suggesting a potential leadership rotation.
- I use the StockCharts scan engine to identify three stocks demonstrating renewed strength despite market weakness.
- Price alerts can help to solidify potential entry points and raise conviction to take action.
There’s no denying the growing signs of a potentially painful leadership rotation in August and September. And while several stocks in the Technology and Communication Services sectors experienced impressive breakouts into August, the last couple of weeks have seen a number of them come back down to retest those breakout levels.
Today, we’ll take a brief look at three mega-cap growth stocks experiencing a bit of weakness in August. From there, I'll share a scan I run often on StockCharts to identify stocks that may be stepping in to take a leadership role into September.
Before I left on a family vacation to Ireland with my family, I shared a series of charts I’d be watching in August to determine whether the normal seasonal patterns were playing out. And the final chart on my list has been flashing warning signs as previous leadership names have run into serious trouble.
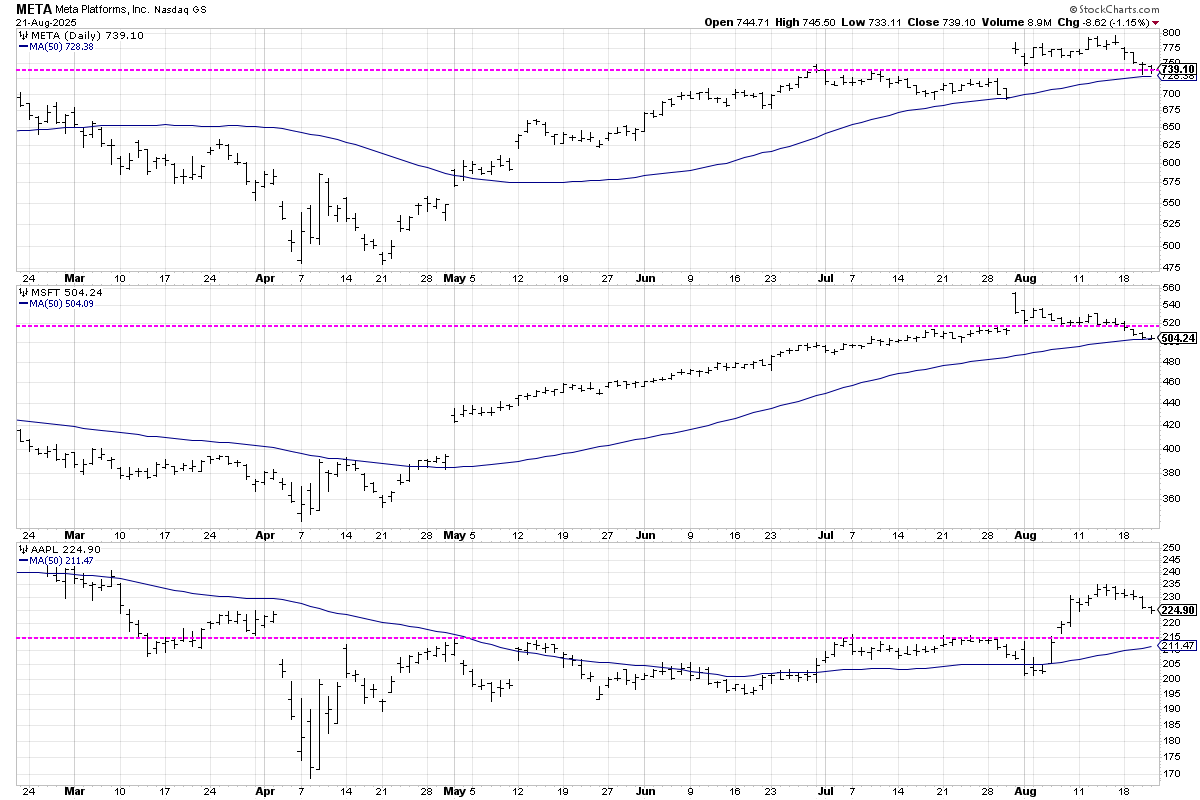
While shares of Meta Platforms (META) and Microsoft (MSFT) both gapped higher last month after stellar earnings reports, both of these names have pulled back over the last week to test their 50-day moving averages.Microsoft has already broken below the previous breakout level around $520. When great companies report great earnings and then fail to appreciate, I begin to get very skeptical of the sustainability of the bull market.
Given the weight these stocks wield in the major equity benchmarks, any further drop below current levels could really weigh on the Nasdaq 100 and the S&P 500. But the good news is that while mega-cap growth names are cooling off, plenty of other stocks are continuing to demonstrate signs of strength.
Using the StockCharts scan engine, I’ve identified three stocks outside of the Magnificent 7 that are at or near new highs, showing improved momentum characteristics and encouraging relative strength profiles.
AT&T (T): An Old-School Telecom with New Momentum
While the largest names in the Communication Services sector have struggled, some of the old-school telecom names have resumed a strong uptrend phase. AT&T stands out as a stock achieving a new 52-week high in August, leading the name to outperform the S&P 500 this month.
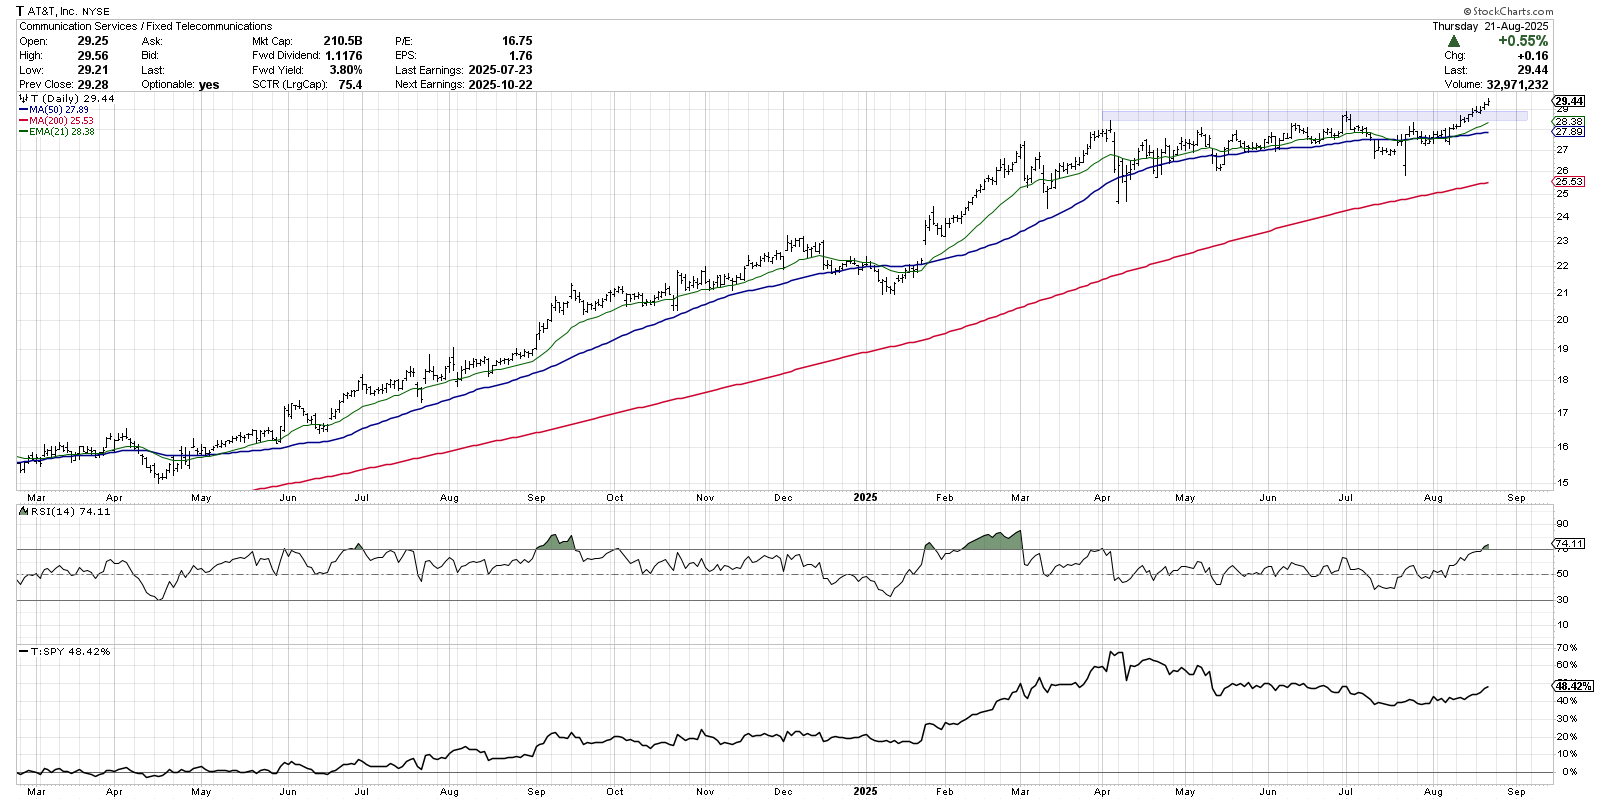
Note that the RSI has pushed into the overbought region this week, which means buyers are clearly taking control. Similar breakouts in January 2025, September 2024, and June 2024 all saw a similar bullish momentum pattern. And even with the stock already gaining about 33% in 2025, T still features a dividend yield of around 3.8%. Strong capital appreciation, along with a decent dividend component, can provide a powerful return combination!
McDonald's (MCD): A Key Test at Resistance
While AT&T has already broken to a new swing high, MCD is just approaching an important resistance level around $320. This is where the stock has stalled out on previous upswings in 2025, and represents a key “line in the sand” to overcome to complete the bullish rotation.
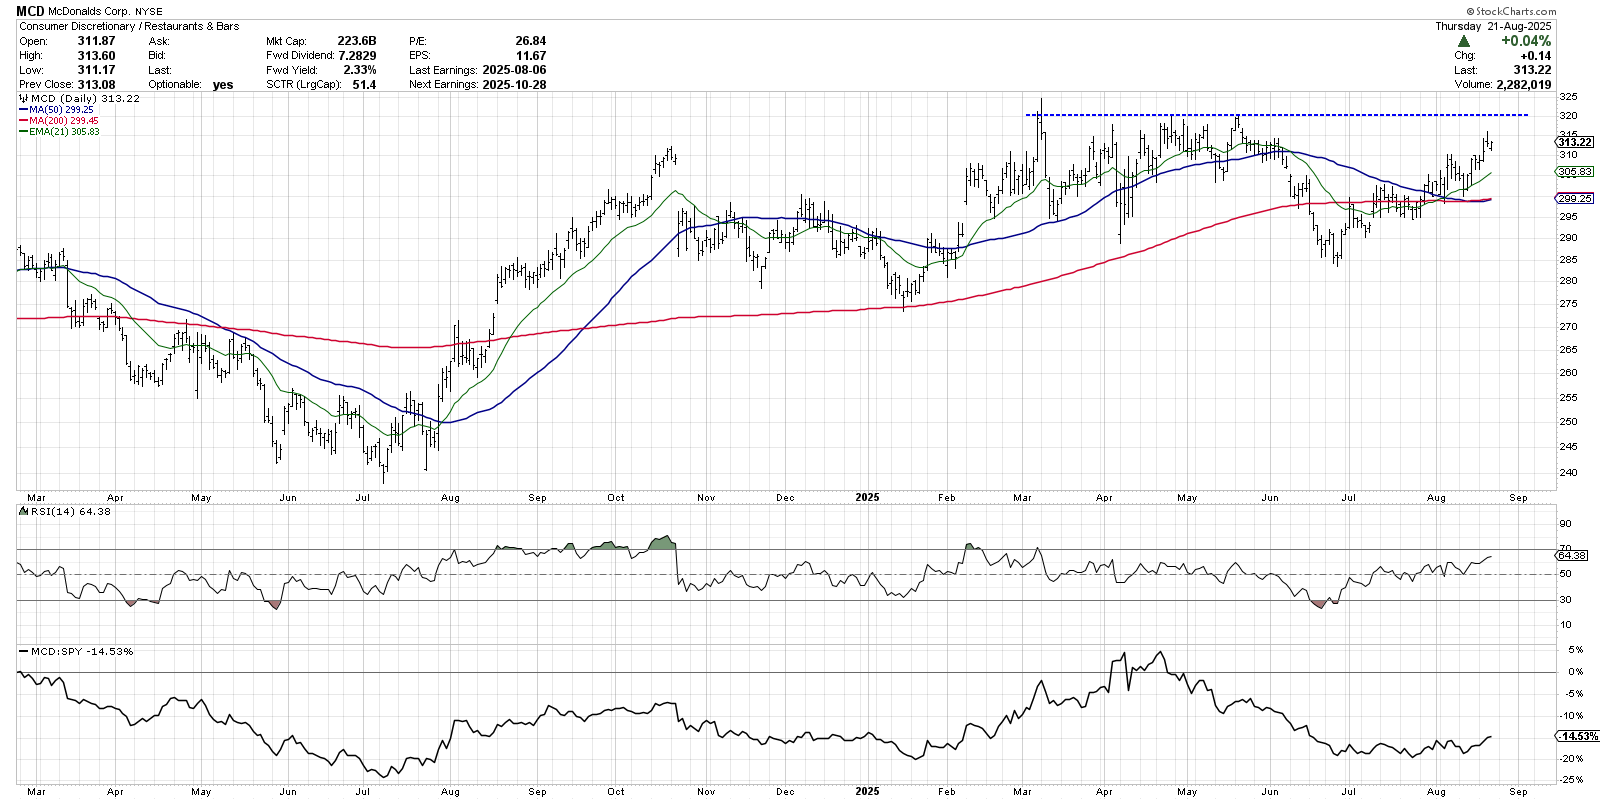
MCD severely underperformed the S&P 500 in Q2, as the stock sold off to a low around $285 while the S&P 500 and Nasdaq 100 were rallying off their April lows. But MCD has now retraced almost 100% of that Q2 selloff and, with improving momentum conditions, it seems that a break above $320 could be in the cards.
Mastercard (MA): Waiting for the Breakout
The chart of Mastercard reveals a consistent theme with all three of these emerging leaders – namely, that every one of them is showing improved relative strength in August, driven by positive price action, while the major benchmarks have struggled. MA is similar to MCD in that the price is testing a key resistance level this week.
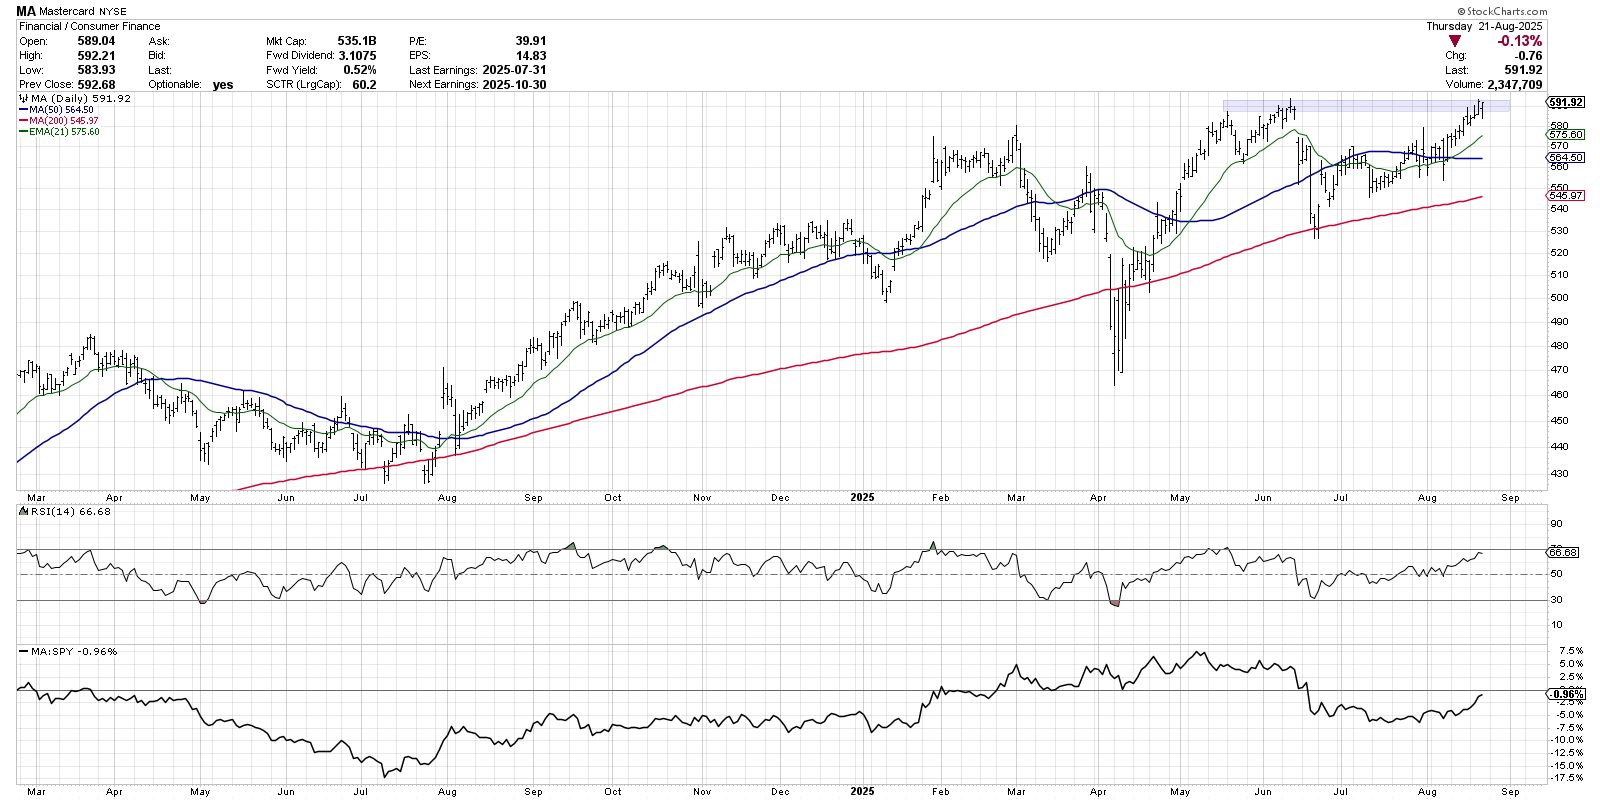
With a chart like Mastercard, I’m happy being patient and waiting for a confirmed break above a well-established resistance level. In this case, I’ve set a price alert for $593, which would represent a new 52-week high and a confirmed breakout above the June peak. While there’s no guarantee that this breakout will occur, it’s so helpful to lay out a potential entry point ahead of time. That way, I’ll be making an investment decision based not on my emotional state, but rather on the evidence that the markets provide back to us in the form of price action!
RR#6,
Dave
P.S. Ready to upgrade your investment process? Check out my free behavioral investing course!
David Keller, CMT
President and Chief Strategist
Sierra Alpha Research LLC
marketmisbehavior.com
https://www.youtube.com/c/MarketMisbehavior
Disclaimer: This blog is for educational purposes only and should not be construed as financial advice. The ideas and strategies should never be used without first assessing your own personal and financial situation, or without consulting a financial professional.
The author does not have a position in mentioned securities at the time of publication. Any opinions expressed herein are solely those of the author and do not in any way represent the views or opinions of any other person or entity.


