Four Roads Diverge in the Market: Which Will the S&P 500 Take?

Key Takeaways
- The S&P 500 held the 6550 support level after Friday's selloff.
- Dave analyzes four different potential future paths for the S&P 500 that could potentially play out.
- Which scenario do you think is most likely? Tell Dave on his YouTube channel!
Up until last Friday, the bulls felt vindicated, as the bears appeared to be in hibernation and the low volatility Great Bull Market of 2025 was firing on all cylinders. It took one big down day last Friday to challenge that entire thesis and bring the relentless uptrend for the S&P 500 into question.
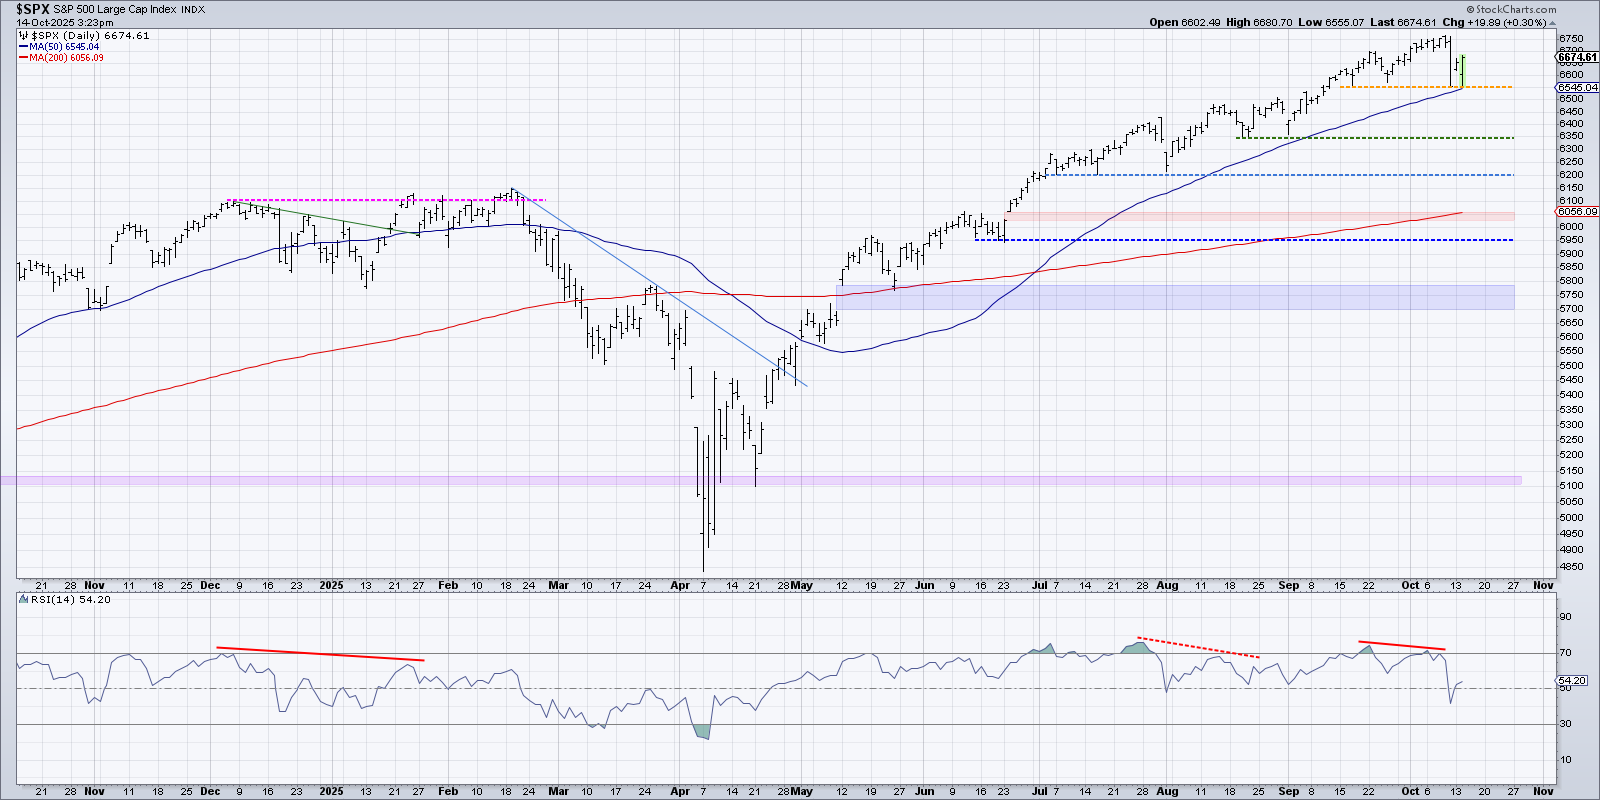
When a market is in a strong uptrend phase, I prefer to use the “line in the sand” technique. As long as the price remains at this key level of support, I agree not to worry too much about what the market is doing. And as long as the uptrend continues, and the chart keeps making higher lows, I continue to move that support level higher.
Last Friday’s drop pushed the S&P 500 right down to my line in the sand at 6550. At this point, the 50-day moving average is right around that 6550 level. This has created a “confluence of support” on the chart, where multiple technical analysis tools are coalescing to a particular price level.
The pace of the market uptrend off the April 2025 low has been nothing short of remarkable. We have experienced minimal drawdowns and very few spikes in volatility during this uptrend phase. Given the lack of any meaningful drawdowns, and especially given that September ended up being a very strong month for risk assets, are we standing on the precipice before a major market correction materializes? Or will October provide yet another short-term pullback within this long-term bullish phase for stocks?
With all of that in mind, it’s time again for one of my favorite exercises, called “probabilistic analysis”. This is where we consider four different potential future paths for a major equity index, think about what could cause these scenarios to play out in real life, and reflect on all the different possibilities.
We most recently conducted this exercise back in August for the Nasdaq 100, and it turns out the QQQ sort of navigated right between two of our clearly delineated scenarios.
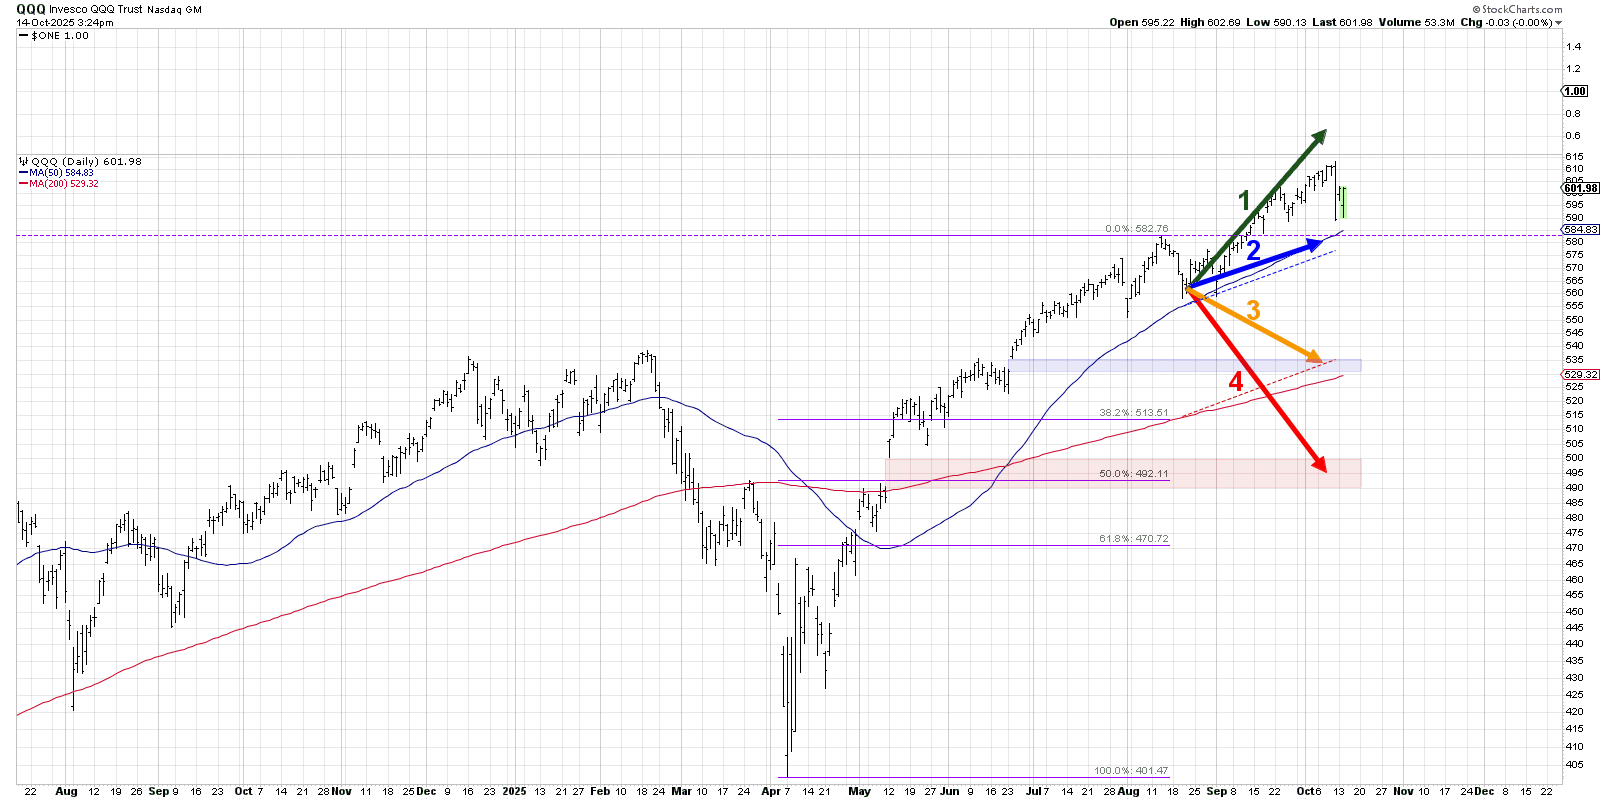
For about four weeks after our video was posted on August 21st, the Nasdaq 100 followed the “super bullish” scenario almost perfectly. But a pullback in late September slowed the pace of the advance, meaning further upside into October but with a gentler slope to the uptrend.
Back to the current markets, let’s review four scenarios for the S&P 500 index between now and the end of November. As a friendly remember, the point of this exercise is threefold:
- Consider all four potential future paths for the index, think about what would cause each scenario to unfold in terms of the macro drivers, and reflect on what signals/patterns/indicators would confirm the scenario.
- Decide which scenario you feel is most likely, and why you think that's the case. Don't forget to drop me a comment and let me know your vote!
- Think about how each of the four scenarios would impact your current portfolio. How would you manage risk in each case? How and when would you take action to adapt to this new reality?
Here’s the chart we’ve created to illustrate the four scenarios. You’ll find a breakdown of each scenario below, along with the probability I’ve assigned for each scenario. Disagree with me? Jump over to my YouTube channel and drop a comment — tell me why I’m wrong!
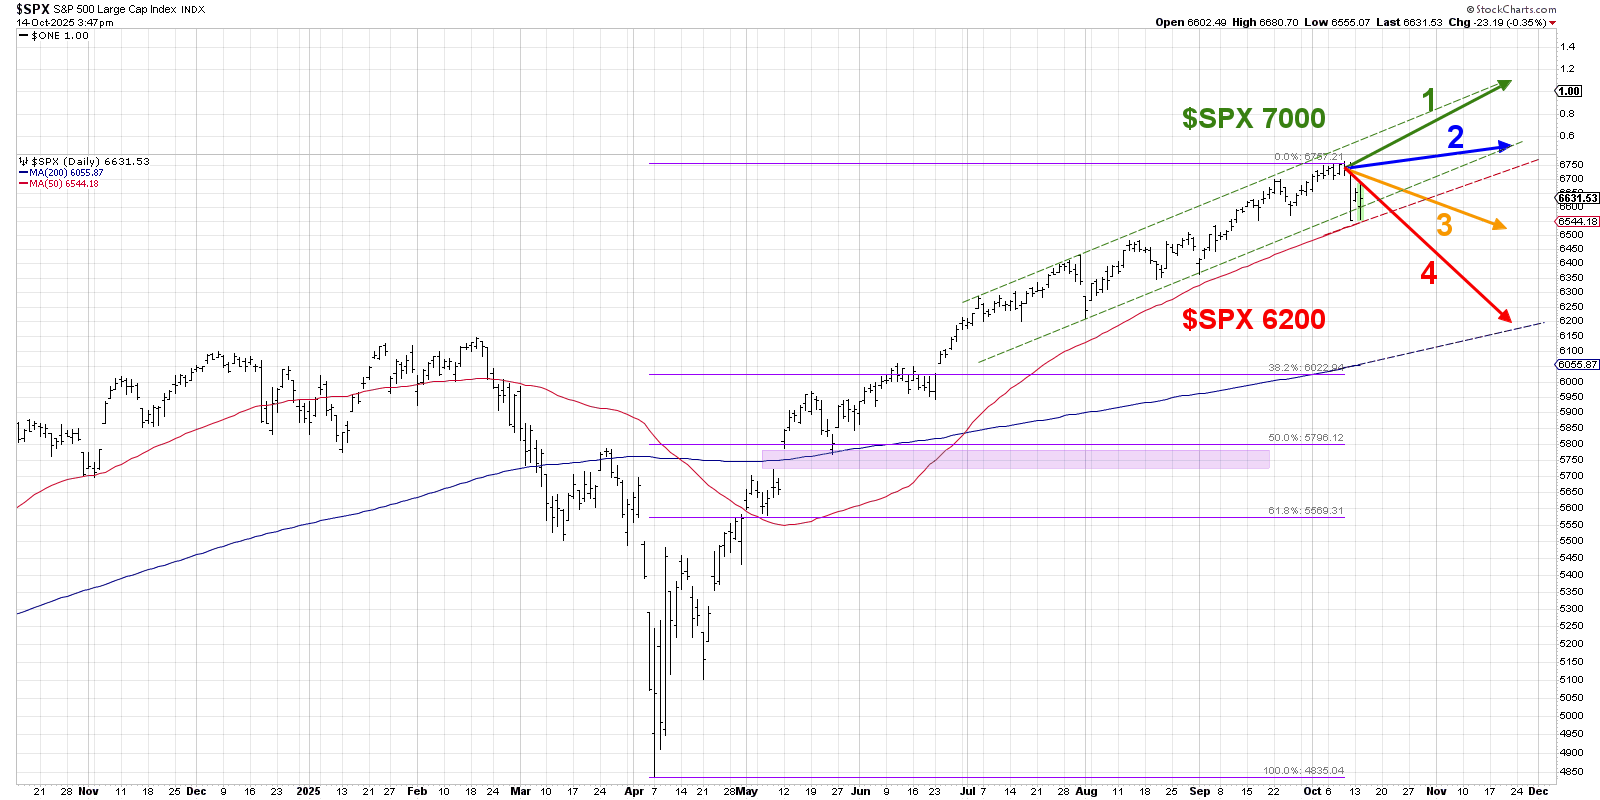
Let’s start with a very bullish outcome, where the S&P 500 resumes the uptrend phase and quickly regains the lost ground from last week’s drop.
Option 1: The Super Bullish Scenario
If we draw a trend channel using the major swing highs and lows since June, we can see that there’s been a fairly consistent uptrend where the highs and lows have shown a parallel slope. And last week’s drop pushed the SPX right down to the lower trend channel line, exactly where pullbacks in August and September found support.
This first scenario would assume that the pullback is pretty much over, that the uptrend would continue at a very similar pace that we’ve seen in the last three months, and that the S&P 500 will be testing the 7000 level right around Thanksgiving. Basically, we assume that all of the AI optimism continues, the government shutdown has limited impact, and “all is well” for risk assets.
Dave’s Vote: 5%
Option 2: The Mildly Bullish Scenario
What if the uptrend continues, and the S&P 500 makes another new high into November, but the pace slows considerably as investors begin to question the optimism outlined in scenario one? If the S&P 500 does more “backing and filling” but remains above the 50-day moving average, we could make a new high but on weaker momentum.
Perhaps the upcoming earnings season begins to shed light on tariff impacts that most investors have considered a non-factor, and signs of the economy slowing down dampen the rampant optimism. Breadth indicators remain challenged, volume indicators show signs of distribution, and even though the market is still going higher, no one seems to feel particularly good about it.
Dave’s vote: 20%
Option 3: The Mildly Bearish Scenario
What if last week’s selloff was just the beginning, and signs of defensive rotations begin to emerge? The bad news about an initial selloff is that it can often lead to additional selloffs, as the Fear of Missing Out (FOMO) turns into a Fear of Losing Everything (FOLE). But if enough investors remain optimistic, and some of the larger growth names hold support, then the downside would most likely be limited for the S&P 500.
We would consider SPX 6550 as a decent target for this “mildly bearish” scenario, which would mean the S&P 500 maybe chops around current levels for the next six weeks but without a major decline materializing.
Dave’s vote: 50%
Option 4: The Super Bearish Scenario
You always need a doomsday scenario, and this fourth scenario is where things quickly transition from “not too bad” to more of “it’s really bad” and in short order. If investors begin to panic, and breadth indicators continue to deteriorate, we could see a retest of the 200-day moving average for the first time since May.
Given the incredible run higher for growth stocks in general, and the elevated valuations that have come from aggressive price appreciation along with limited earnings growth, it’s not hard to imagine a scenario where the proverbial music stops and everyone’s afraid they’ll hold on too long.
That would mean the S&P 500 drops to around 6200 by Thanksgiving, representing about only about an 8% decline from the October peak. But given the low volatility uptrend we’ve experienced in recent months, that sort of selloff would feel like a much more significant decline!
Dave’s vote: 25%
What probabilities would you assign to each of these four scenarios? Check out the video below and then drop a comment with which scenario you select and why!
RR#6,
Dave
P.S. Ready to upgrade your investment process? Check out my free behavioral investing course!
David Keller, CMT
President and Chief Strategist
Sierra Alpha Research
marketmisbehavior.com
Disclaimer: This blog is for educational purposes only and should not be construed as financial advice. The ideas and strategies should never be used without first assessing your own personal and financial situation, or without consulting a financial professional.
The author does not have a position in mentioned securities at the time of publication. Any opinions expressed herein are solely those of the author and do not in any way represent the views or opinions of any other person or entity.


