Mixed Signals to Start the Year: Is Stock Market Leadership Changing?

Key Takeaways
- Market leadership is being tested early in the year.
- Crude oil, the U.S. dollar, and Bitcoin are showing signs of breaking out of multi-month downtrends or consolidations.
- Price action, not headlines, will determine what comes next.
While headline news has dominated attention so far this week, several key areas of the stock market are showing notable shifts in price action beneath the surface.
JP Morgan Chase (JPM) kicked off bank earnings Tuesday morning, and the market reaction was clearly negative. Shares closed down 4.19% following the Q4 earnings report. Adding pressure to the Financials sector, President Trump announced plans to implement a 10% cap on interest rates, sending credit card and bank-related stocks lower.
At the end of November, after bouncing off the support of its 200-day Simple Moving Average (SMA), the Financial Select Sector SPDR Fund (XLF) has been in a relatively healthy uptrend, maintaining its position above its 21-day EMA.
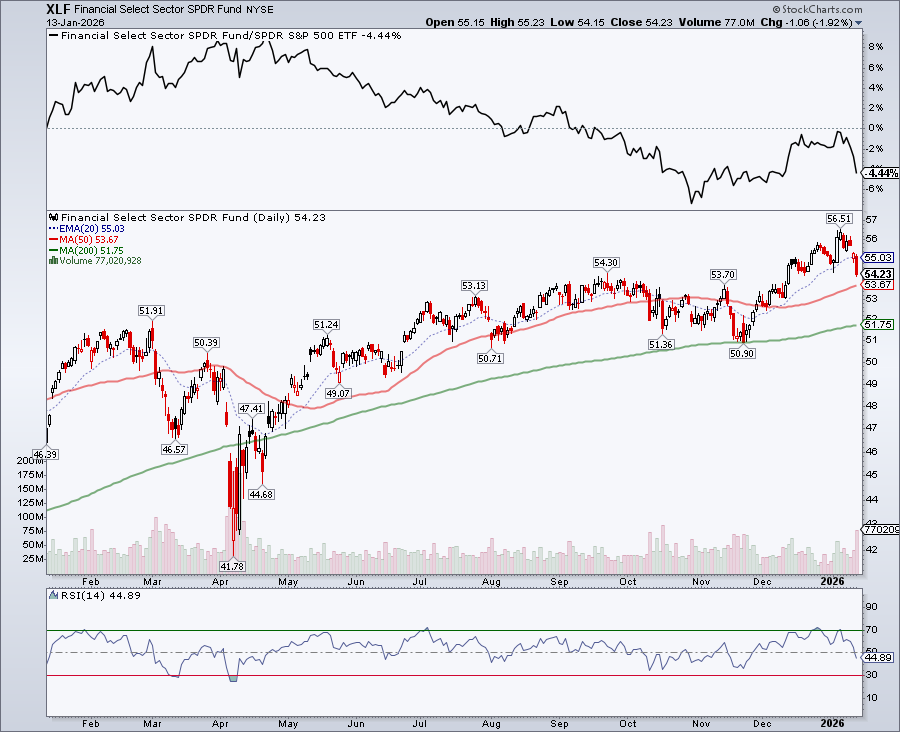
The short-term trend was tested Tuesday as XLF price action took the ETF below its 21-day EMA. While momentum had already been weakening in early January, the latest pullback confirmed the loss of strength. Relative strength versus the S&P 500 is rolling over (see top panel), and the Relative Strength Index (RSI) is weakening (bottom panel).
With additional bank earnings ahead, this sector deserves close attention. Bank earnings set the tone for the rest of earnings season, and today’s weakness raises some concerns.
Crude Oil Shows Signs of Life
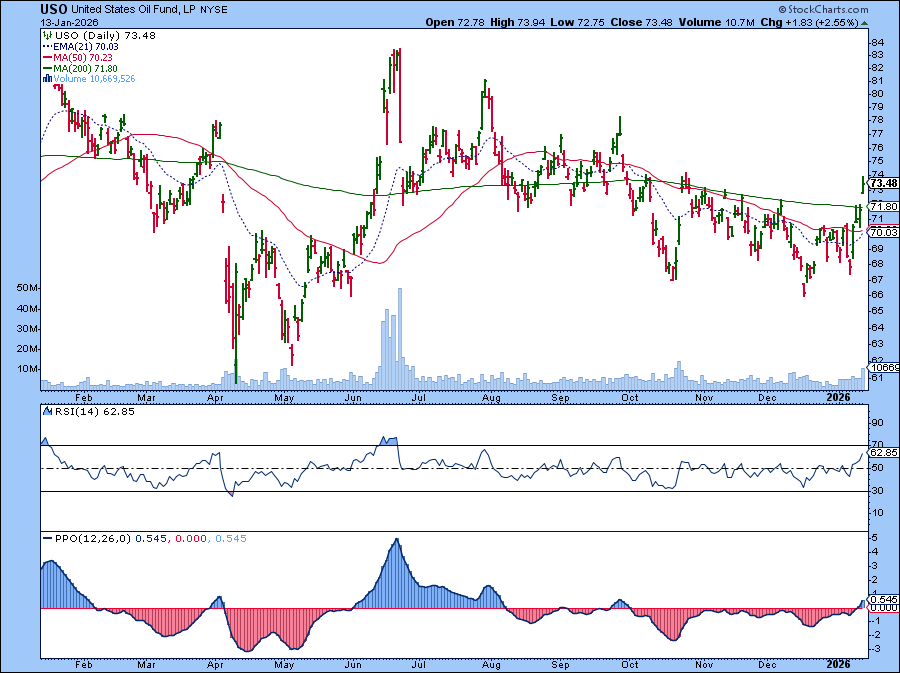
Crude oil is another area where price action is beginning to change. After trending lower for several months, crude has broken its downtrend and is now advancing toward its 200-day SMA. While a full trend reversal has not yet been confirmed, a decisive move above the 200-day SMA would be a meaningful technical development.
The United States Oil Fund (USO) closely mirrors this behavior. Momentum is improving, with the RSI and Percentage Price Oscillator (PPO) turning higher.
Dollar’s Strength
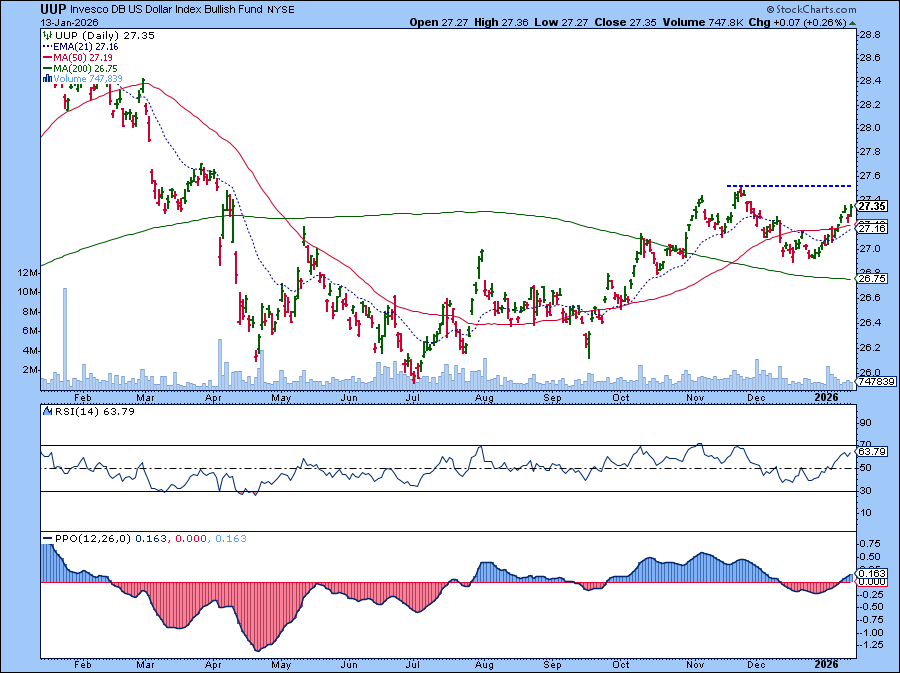
The U.S. Dollar is also showing renewed strength following a prolonged downtrend and subsequent consolidation. The Invesco DB US Dollar Index Bullish Fund (UUP) is gaining upside momentum. A breakout above $27.50, together with the RSI breaking above 70 and a rising PPO, could see the dollar gain strength. If this happens, gold and silver prices could stall.
Bitcoin Breaks Higher
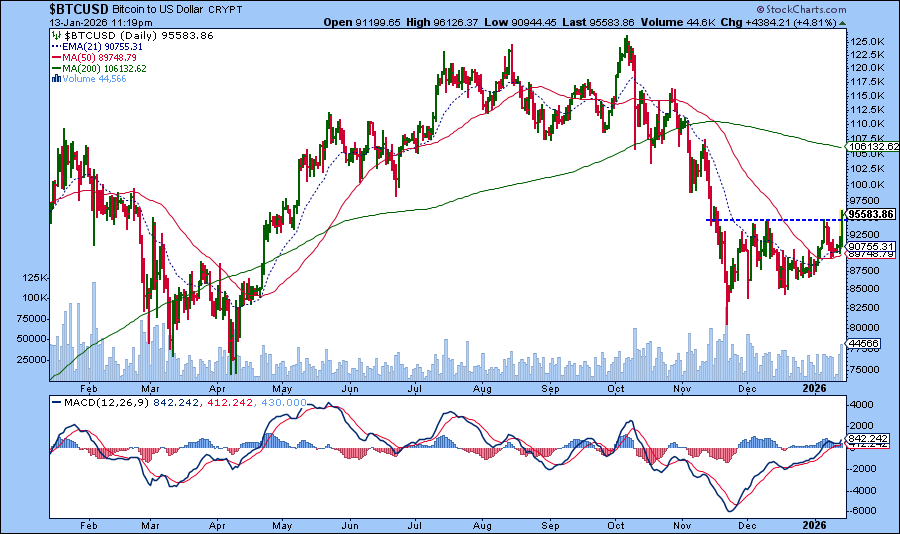
Bitcoin has also begun to perk up. The daily chart of $BTCUSD shows a breakout above a key resistance level. The Moving Average Convergence/Divergence (MACD) has crossed into positive territory. A continued advance followed by a pullback would be constructive, as MACD crossovers close to the zero line often lead to more sustained uptrends.
Technology Losing Momentum?
While several asset groups are showing early signs of trend reversals or breakouts, technology stocks are beginning to slow.
The Technology Select Sector SPDR ETF (XLK) has been consolidating since its late October high.
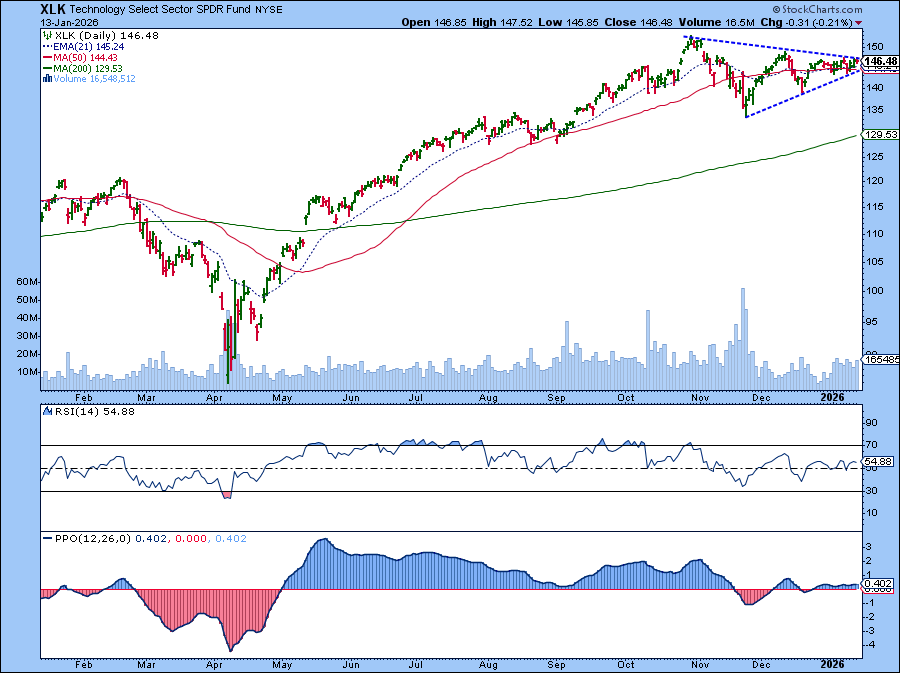
Momentum has also faded, as seen in the RSI and PPO. If tech leadership weakens, it could challenge the broader market strength that defined the past few years.
Shifting Winds
A combination of earnings reactions, policy headlines, and technical shifts may be altering investor preferences. Will these early signs set the stage for the rest of the year, or will they be short-term moves?
Keep a close eye on the price action in crude oil, the U.S. dollar, and Bitcoin. If we see sustained trend reversals in these asset groups while technology stocks slip, we could see a changing market environment as the year unfolds.
Disclaimer: This blog is for educational purposes only and should not be construed as financial advice. The ideas and strategies should never be used without first assessing your own personal and financial situation, or without consulting a financial professional.


