Momentum, Divergences, and the Bull’s Next Move

Key Takeaways
- The major stock market indexes closed at record highs, showing the bull market still has momentum.
- Price action, momentum, breadth, and sentiment indicators suggest healthy investor behavior.
- Focus on the charts to spot early signs of shifts in investor sentiment.
September’s inflation report finally arrived. The CPI came in softer than expected, which was all the market needed to get excited. The Dow Jones Industrial Average($INDU), S&P 500 ($SPX), and Nasdaq Composite ($COMPQ) also closed at record highs, shaking off October’s earlier losses like they never happened.
With a stock market that’s sitting at lofty levels, it’s natural for investors to get a little fearful, especially if there’s any indication of a pullback or correction. But what matters isn’t that prices dip; it’s how they react during those pullbacks.
The Rally That Could
Since the April 2025 low, the S&P 500 has been unstoppable, climbing higher and higher with a few pauses. To get a clearer view of what’s happening, let’s look at a daily chart of the SPDR S&P 500 ETF (SPY), which mirrors the S&P’s movements. We’ll zoom in on what happened before the October 10 selloff.
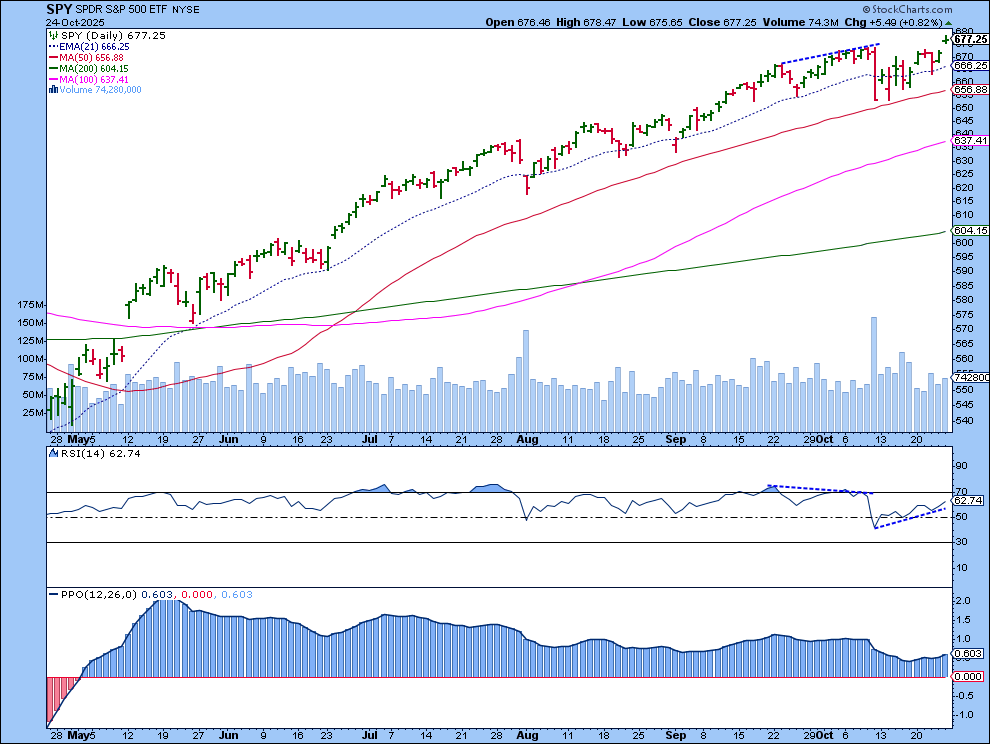
Note the slight divergence between the Relative Strength Index (RSI) and price. After SPY hit a high on September 22, there were three down days. During that dip, the RSI fell from around 72 to 59. That told us momentum was cooling a bit. But buyers stepped in right around the 21-day Exponential Moving Average (EMA) and, from there, SPY bounced back and continued on its bullish path. The RSI also started rising and peaked just below 72, then turned lower. It didn’t surpass the 72 level of September 22. That slight divergence was the first signal of momentum slowing down.
Similarly, the Percentage Price Oscillator (PPO) showed a similar scenario. Momentum slowed after the October 10 selloff but is showing signs of nudging higher.
A Healthy Pause?
Of course, nobody could have anticipated the magnitude of the October selloff, but the earlier clues were an alert that perhaps the overstretched market was due for a breather. In a headline-driven market, it doesn’t take much to shake investor confidence.
Looking back at the chart, the October 10 selloff didn’t break below the 50-day SMA, and price stayed above that day’s low. The RSI also started to trend higher, an indication that momentum is picking up. So for now, it looks like the bull still has some room to run.
As investors shifted to risk-on mode, gold and silver prices, which have been on impressive runs, took a break. Let’s look at what that means for gold.
Gold’s Shine Fades a Little
The daily chart of SPDR Gold Shares (GLD) shows that after GLD hit an all-time high of $403.30 on October 20, it fell hard the next day, landing on its 21-day EMA support. It has bounced off that level since, and momentum has also cooled as indicated by the RSI and Moving Average Convergence/Divergence (MACD).
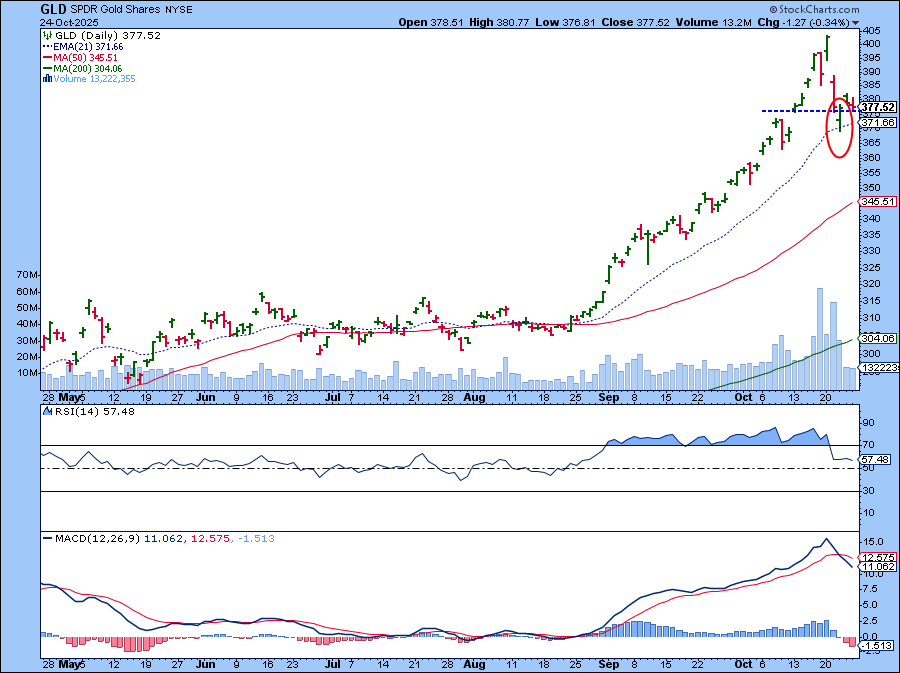
We’ll need to see if GLD retests the 21-day EMA again. That could tell us if gold’s ready to move higher or if the pullback will stay for a while.
Despite gold’s pullback, its longer-term performance still looks strong. Over the past year, it has outpaced equities and other asset groups.

What Should Investors Watch Now?
Looking at price action, the stock market seems to have shaken off its indecisiveness and is leaning toward “I want to move higher.” A few clues indicate the potential for an upward move.
- The Cboe Volatility Index ($VIX) is below 20, which means investor fear has eased.
- The major indexes are trading above their 50- and 200-day moving averages.
- More than half of the S&P 500 stocks are trading above their 200-day moving average.
- Investors have switched from offense to defense mode.
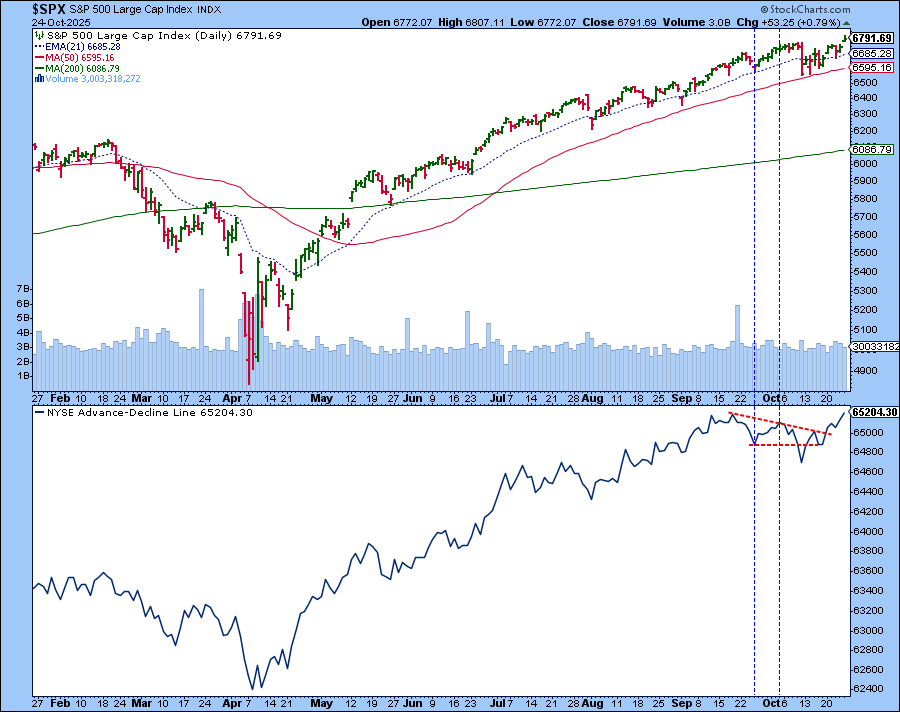
My go-to “big picture” chart pairs the S&P 500 and the NYSE Advance-Decline Line. The A-D line is supporting the upside move in the S&P 500 shows broad market participation. A break above its September 18 high would reinforce the bullish case.
Final Thoughts
The overall picture indicates the bull market could continue moving higher in the near term. The stock market is showing healthy signs of strength, and with earnings from big tech and health care companies coming up, we could see more upside movement.
However, there are several external factors, such as trade tensions and geopolitical headlines, that could surface and flip sentiment on a dime. Investors should closely monitor the market indicators available in the Market Summary page, i.e. breadth, sentiment, and key ratios, to look for early signs of any weakness.
End-of-Week Wrap-Up
- Stock Market Weekly Performance
- Dow Jones Industrial Average: 47,207 (+2.20%)
- S&P 500: 6,791.69 (+1.92%)
- Nasdaq Composite: 23,204.87 (+2.31%)
- $VIX: 16.37 (-21.22%)
- Best performing sector for the week: Technology
- Worst performing sector for the week: Consumer Staples
- Top 5 Large Cap SCTR stocks: IREN Ltd. (IREN); Sandisk Corp (SNDK); Bloom Energy (BE); BitMine Immersion Technologies (BMNR); Oklo Inc. (OKLO)
On Our Radar Next Week
- Fed Interest Rate Decision
- Big Tech earnings — Microsoft (MSFT), Alphabet (GOOGL), Meta Platforms (META), Apple (AAPL), Amazon (AMZN) — plus earnings from UnitedHealth Group (UNH), Caterpillar (CAT), Boeing (BA), Eli Lilly (LLY), Gilead Sciences (GILD), and several others.
- September PCE
- September Durable Goods Orders
Disclaimer: This blog is for educational purposes only and should not be construed as financial advice. The ideas and strategies should never be used without first assessing your own personal and financial situation, or without consulting a financial professional.


