Nifty Near Highs as Sector Leadership Rotates on RRG
The markets traded with a positive bias through the week, maintaining a broadly upward trajectory and ending with net weekly gains. The Nifty moved in a narrow intra-week range of 390.45 points, oscillating between a low of 25,856.20 and a high of 26,246.65. Volatility surged sharply, with the India VIX spiking by 14.18% on a weekly basis to close at 13.63, indicating a notable uptick in hedging activity. The Nifty ended the week higher by 158.10 points or 0.61%.
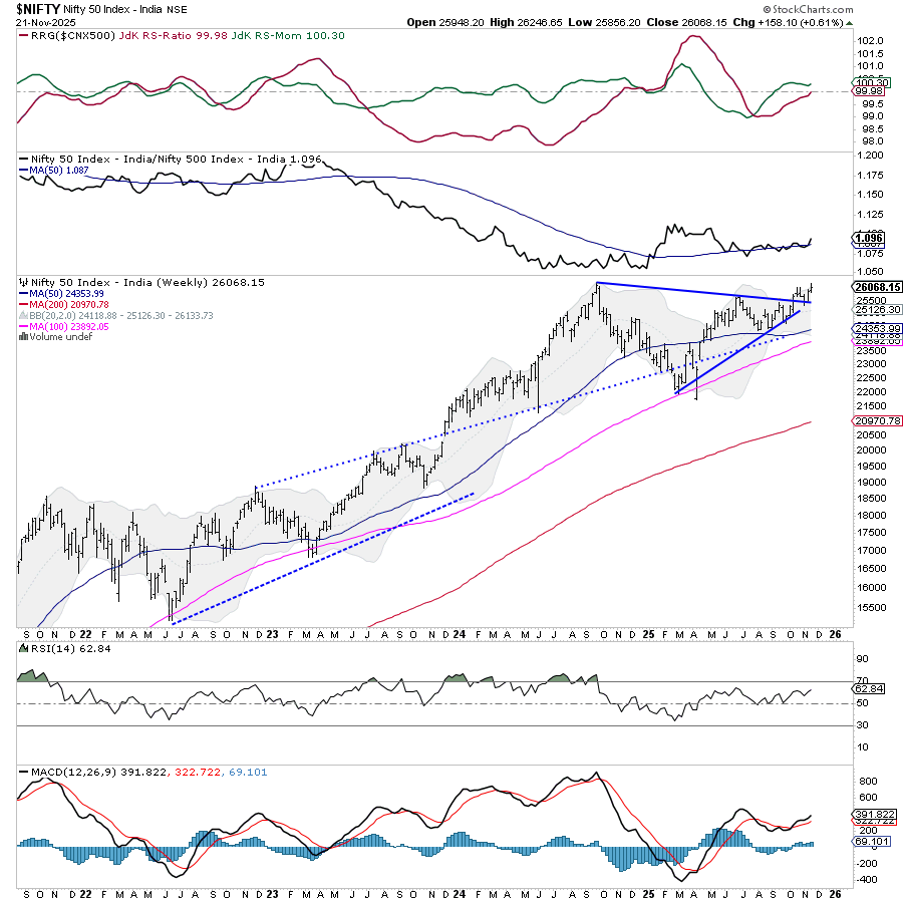
At present, the Nifty finds itself at a crucial inflection zone. While it is trading just below its all-time high of 26,277, the index faces immediate overhead resistance at the 26,100 level. A decisive breakout above this zone on a closing basis is likely to open the gates for the index to test 26,277 swiftly and potentially advance towards 26,500. Structurally, the broader trend remains firmly up, supported by higher lows and strong momentum. Put writing activity at 25,900–26,000 strikes further strengthens the bullish setup, suggesting that market participants are positioning for further upside unless a breakdown occurs below key support levels.
Given the current setup, the Nifty is expected to see a buoyant start to the coming week. Immediate resistance stands at 26,175, followed by the all-time high of 26,277. Beyond this, 26,500 will act as the next resistance. On the downside, the levels of 25,850 and 25,700 will act as immediate and critical supports, respectively.
The weekly RSI stands at 62.82 and continues to show strength without any divergence, indicating a strong underlying trend. The weekly MACD remains bullish and above its signal line, with a widening histogram supporting continued momentum. No divergence is observed. The weekly candle is a small-bodied white candle near resistance, which may imply some hesitation but does not negate the trend.
From a pattern perspective, the index has broken out of a multi-month symmetrical triangle formation, a bullish continuation pattern, and is now retesting and taking support at its upper trendline. The breakout remains valid as long as the Nifty holds above the 25,650–25,700 zone. All key moving averages (20, 50, 100, and 200 weeks) continue to trend higher and remain supportive of the long-term uptrend.
Given the structure, a prudent approach would be to remain selectively bullish. Traders should look to ride the trend while protecting profits with trailing stop-losses. Aggressive long positions can be considered on a decisive move above 26,100, while any dip towards 25,650–25,700 should be viewed as a buying opportunity. A cautious and stock-specific approach is advisable until the index breaks out convincingly above 26,100.
Sector Analysis for the Coming Week
In our look at Relative Rotation Graphs®, we compared various sectors against the CNX500 (NIFTY 500 Index), representing over 95% of the free-float market cap of all the listed stocks.
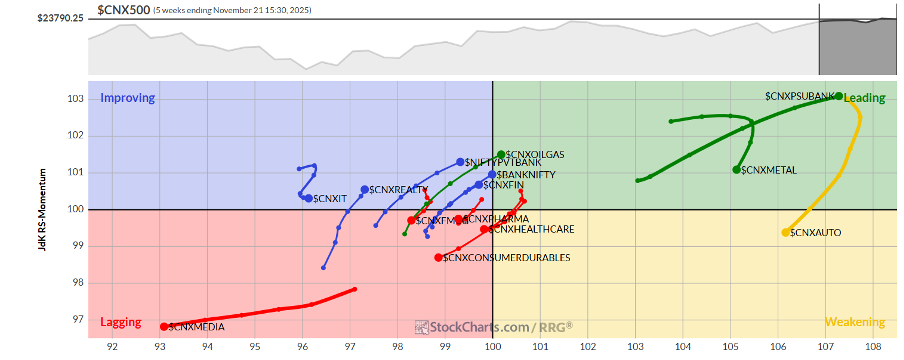
Relative Rotation Graphs (RRG) show a mild shift in leadership in the markets. The Infrastructure Index has rolled inside the leading quadrant. Besides this, the PSU Banks and Metal Index also remains inside the leading quadrant. These groups are likely to relatively outperform the broader markets.
The Auto Sector Index has rolled inside the weakening quadrant. Stock-specific individual performance may continue, but overall relative performance may see a mild slowdown. The Nifty Midcap-100 Index is also inside the weakening quadrant, but it is sharply improving its relative momentum against the broader markets.
The Nifty Media, Consumption, FMCG, and Commodities Indices continue to languish inside the lagging quadrant. These groups are likely to relatively underperform the broader markets. The Nifty Pharma Index is also inside the lagging quadrant; however, it is seen improving its relative momentum against the broader markets.
The Nifty Financial Services, Realty, and Services Sector Indices have rolled inside the improving quadrant, indicating a likely beginning of their phase of relative outperformance. The IT, PSE, Nifty Bank, and Energy Indices are also inside the improving quadrant. These groups are likely to improve their relative performance over the coming days.
Important Note: RRG™ charts show the relative strength and momentum of a group of stocks. In the above chart, they show relative performance against NIFTY500 Index (Broader Markets) and should not be used directly as buy or sell signals.
Milan Vaishnav, CMT, MSTA
Consulting Technical Analyst
www.EquityResearch.asia | www.ChartWizard.ae


