NVIDIA Under Pressure: Eyeing a Near-Term Bearish Options Strategy
Key Takeaways
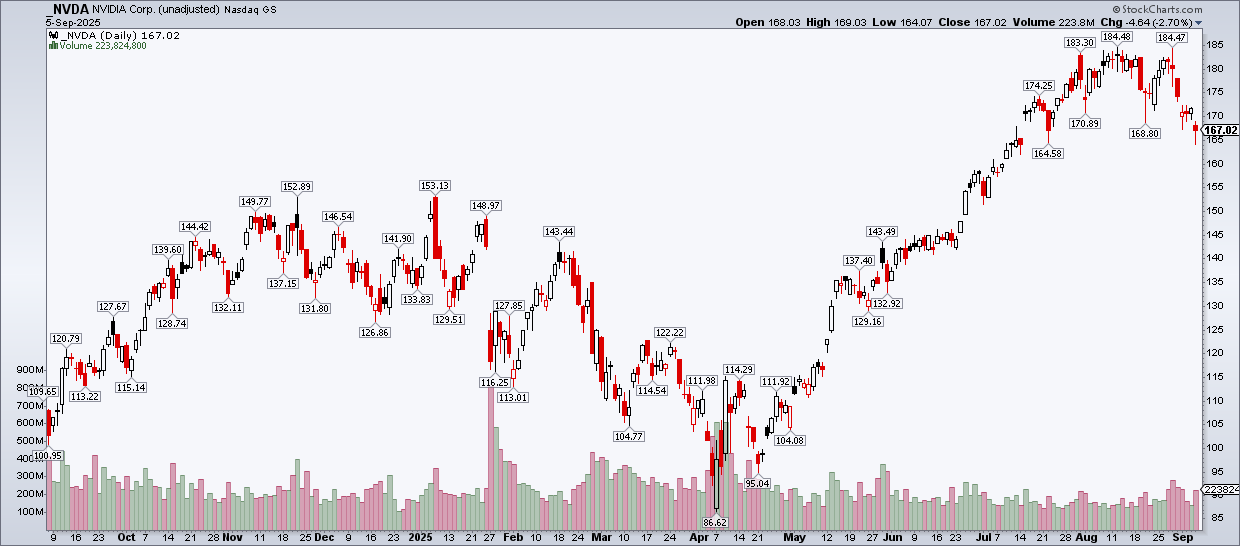
- Shares of the world’s largest public company slipped below their 50-day moving average last week.
- Flirting with correction territory and facing weak seasonals, Mike spotlights a bearish NVDA options setup using StockCharts’ OptionsPlay Strategy Center.
- Upcoming company events could stir fresh volatility.
NVIDIA (NVDA) enters Inflation Week on Wall Street on shaky footing. To begin September, shares traded below their 50-day moving average for the first time since early May. On a relative basis, the stock lost ground to the S&P 500 for seven sessions running coming into the first full week of this month. Then, just this morning, Citigroup trimmed its NVDA price target from $210 to $200.
As always, there’s a fundamental story behind the price move. Broadcom (AVGO) reported its Q3 numbers last Thursday night, posting solid sales and profits, along with news of a “secret buyer” of its custom chips. That prompted analysts to rethink the chip landscape. Before that, China’s consumer giant Alibaba (BABA) unveiled its own AI semiconductors to potentially fill the void from possible selling barriers placed on the world’s most valuable public company. Chip wars may already be underway.
All of this comes after yet another stellar quarterly earnings report put out by Jensen Huang’s company. NVIDIA issued Q2 non-GAAP EPS of $1.05, topping the street’s target by $0.04, while revenue grew by more than 55% from the same period a year earlier to $46.7 billion. Revenue guidance for the quarter now underway was also ahead of estimates, but shares wavered.
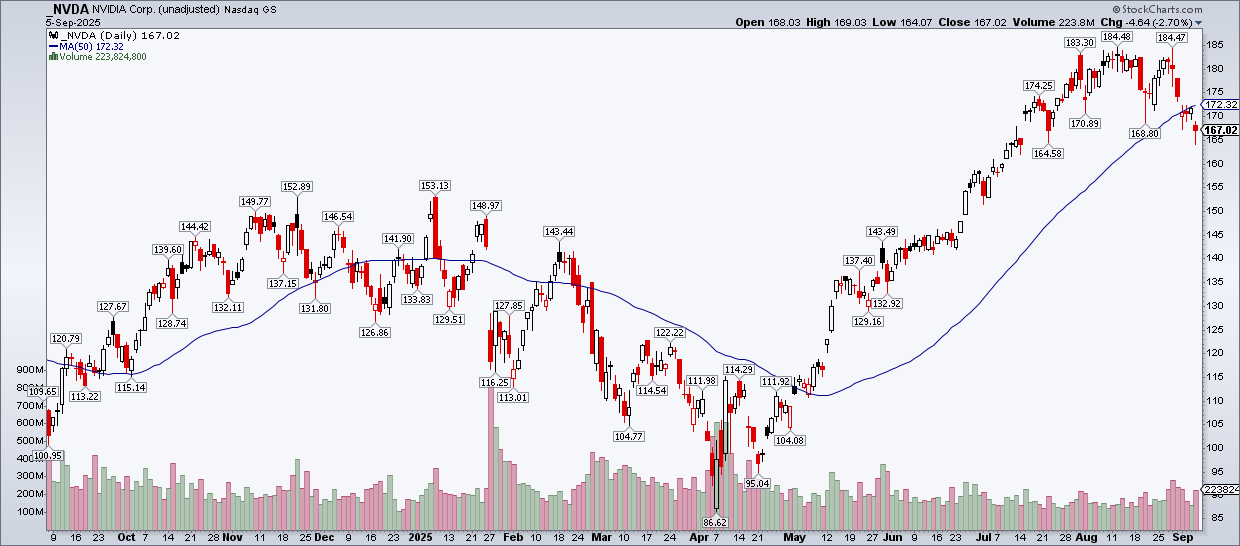
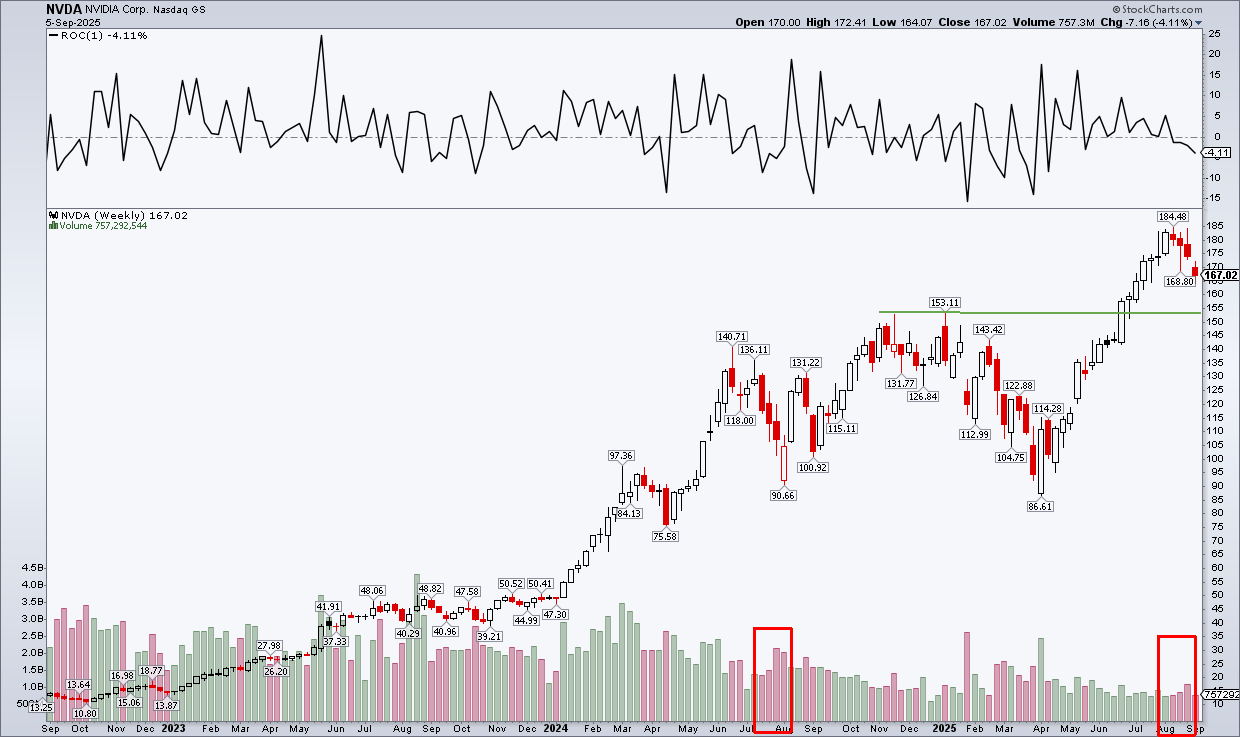
NVDA had more than doubled from its post-Liberation Day intraday low of $86.62 to an August 12 high of $184.48. Traders can spot the precise troughs and peaks by applying the “Price Labels” display settings on SharpCharts—I almost always impose that level of granularity to more easily call out support and resistance spots.
The stock failed to break out in the wake of the Q2 report, however. The Alibaba news, followed by Broadcom perhaps playing some catch-up, stirred NVDA bears (at least modestly so). Shares dipped into technical “correction” territory at the low of the session on Jobs Day last Friday. For the holiday-shortened week, NVDA shed 4.1%, marking a fourth consecutive weekly decline. The last time the $4.1 trillion market cap stock endured a four-week losing streak? July-August 2024.
Let’s home in on the options scene. Among the first indicators I inspect when scanning puts and calls is a stock’s implied volatility (IV)—an annualized percentage of the underlying asset’s expected move up or down. Thirty days is the default and, right now, NVDA’s implied volatility is tame at 34%. A 34% IV discounts a 9.8% swing in the stock over the next month (simply divide 34 by the square root of 12 to arrive at the expected monthly swing).
With a little Options 101 under our belt, let’s venture to StockCharts’ OptionsPlay Strategy Center. NVDA appears under the “Bearish Underperformance” Trend Scans when filtering for “Long Puts” under the Strategy option. With a Timeframe of “30 days” and a “Balanced” Risk Profile, the OptionsPlay Score for those criteria is 103.
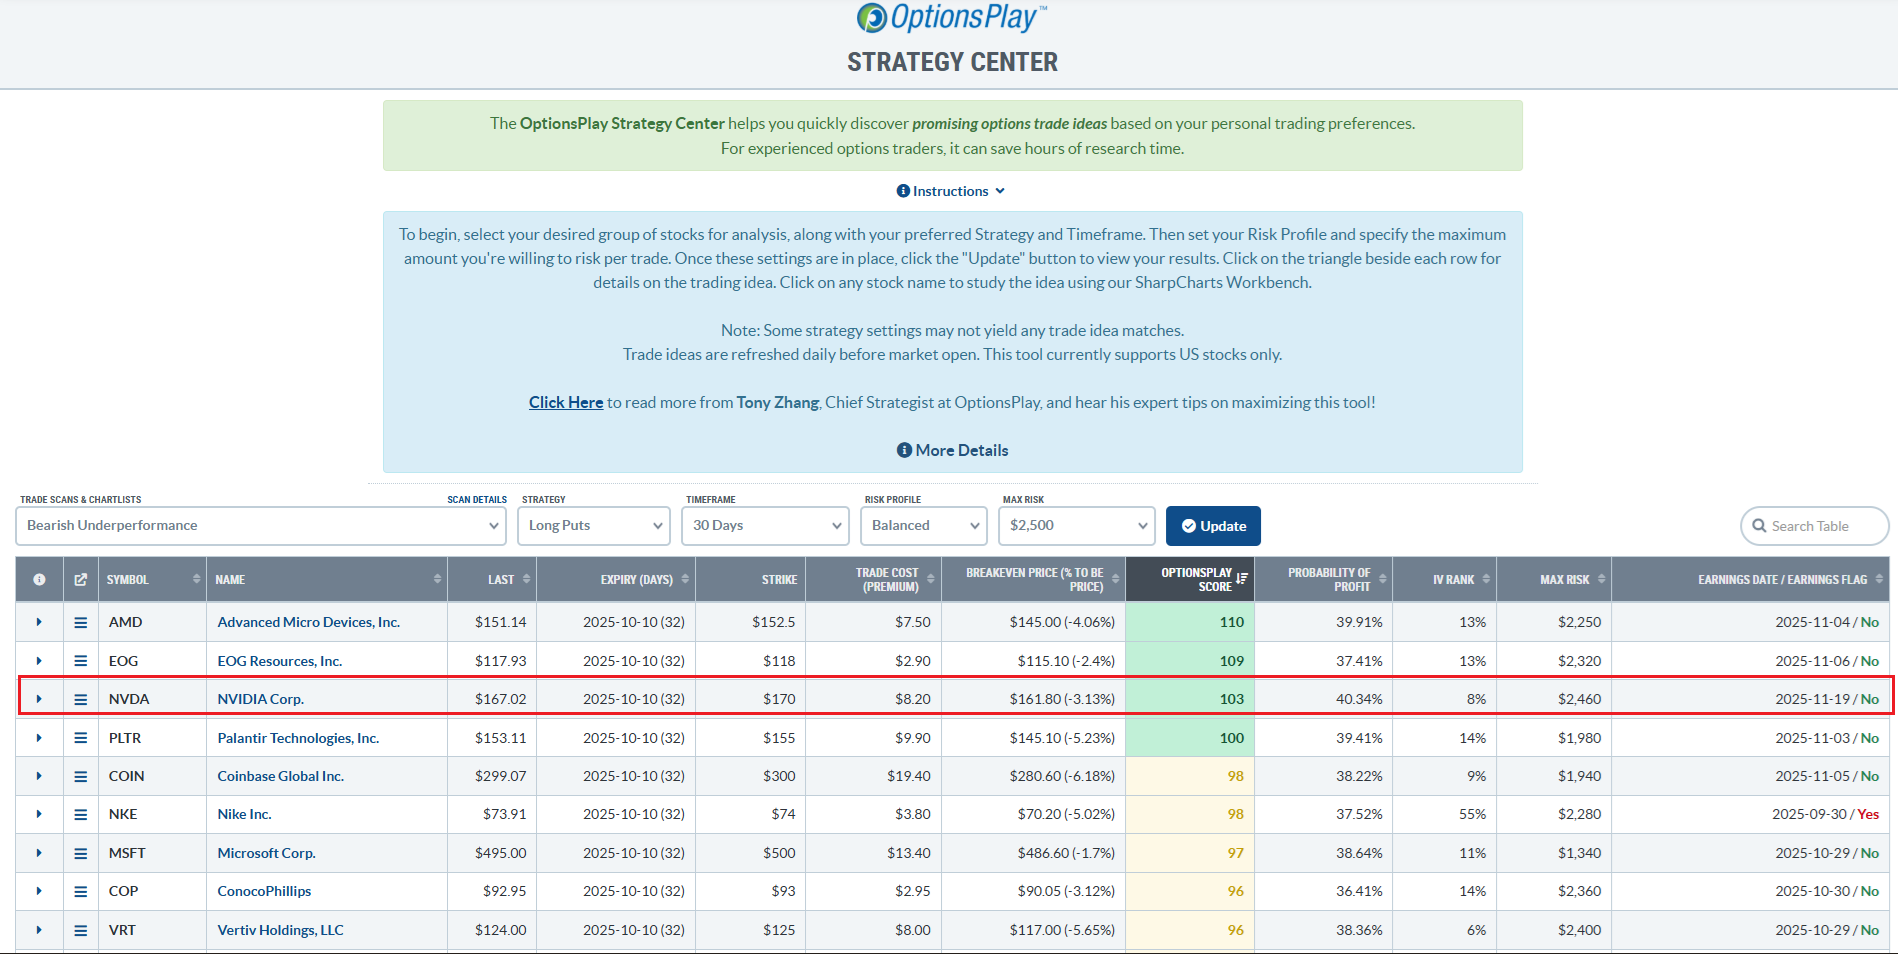
But what is the OptionsPlay Score? Inspired by risk assessment in poker, it mimics how a bettor gauges a hand’s possible outcomes based on overall risk, reward, and probability. The score ranges from 0 to 250, with scores above 100 suggesting a positive expected value and a risk-to-reward ratio in the trader's favor. The OptionsPlay Strategy Center is color-coded to give traders a quick visual sense of a strategy’s potential.
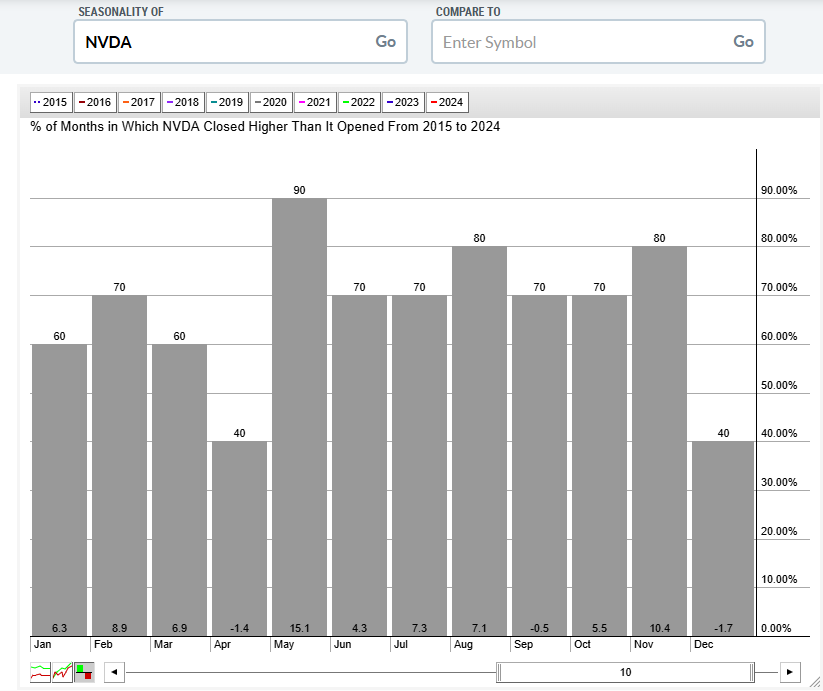
NVDA’s $170-strike weekly put options expiring on October 10 could also be a play on notoriously weak seasonality in the broader market. The further we go into September, the worse daily returns tend to be. Additionally, the old technical adage “sell Rosh Hashanah, buy Yom Kippur” may trigger selling on the month’s final session.
Should you buy NVDA puts merely due to calendar trends and dated rules of thumb? Certainly not, but seasonality is a valuable tool in your toolkit. The stock itself has averaged an 0.5% decline with a 70% positivity rate over the past 10 years in the final month of the third quarter.
So, while buying the NVDA October 10 $170-strike put boasts a solid OptionsPlay Score and appears quantitatively favorable, it’s important to “invert.” I mean, what could go right for NVDA that would upend the bearish trade?
With no earnings report on tap, the company’s executives are slated to present at several industry conferences, including the Goldman Sachs Communacopia Technology Conference 2025 in San Francisco today through Thursday. Any positive words on either the supply or demand side could reverse the recent downtrend.
The Bottom Line
The S&P 500 is at record levels, but with no recent help from its biggest component. NVDA has underperformed the SPX by almost 10 percentage points over the past four weeks, despite reporting a gangbuster Q2. Now below the key 50-day moving average, playing the stock from the short side could work over the next month. The OptionsPlay Strategy Center scores a near-term long-put idea highly as we progress toward quarter-end.


