One Sector Stands Strong as the Most Economically Sensitive Sector Breaks Down
Key Takeaways
- A very mixed market with a high percentage of stocks in downtrends
- Health Care stands out with strength in three timeframes; breadth improves as XLV extends on breakouts
- EW Consumer Discretionary breaks down as breadth deteriorates
Stock market performance remains mixed with a high percentage of S&P 500 stocks trading below their 200-day SMAs. This number has yet to exceed 50%, but should be watched because the Consumer Discretionary and Technology sectors show deterioration. Despite a mixed market, the Health Care sector is rising above the rest, with strong performance numbers over three timeframes; the XLV price chart is also bullish. In contrast, the EW Consumer Discretionary ETF is breaking down and underperforming the broader market.
A Very Mixed Market
The market is very mixed with barely 50% of S&P 500 stocks above their 200-day SMAs. In the middle window, SPX %Above 200-day SMA ($SPXA200R) is at 53%, which means 47% of S&P 500 stocks are below their 200-day SMAs, and in long-term downtrends. Even though over 50% of stocks are above, a high percentage are below, which makes this a split market. A move below 50% would show further deterioration within the S&P 500.
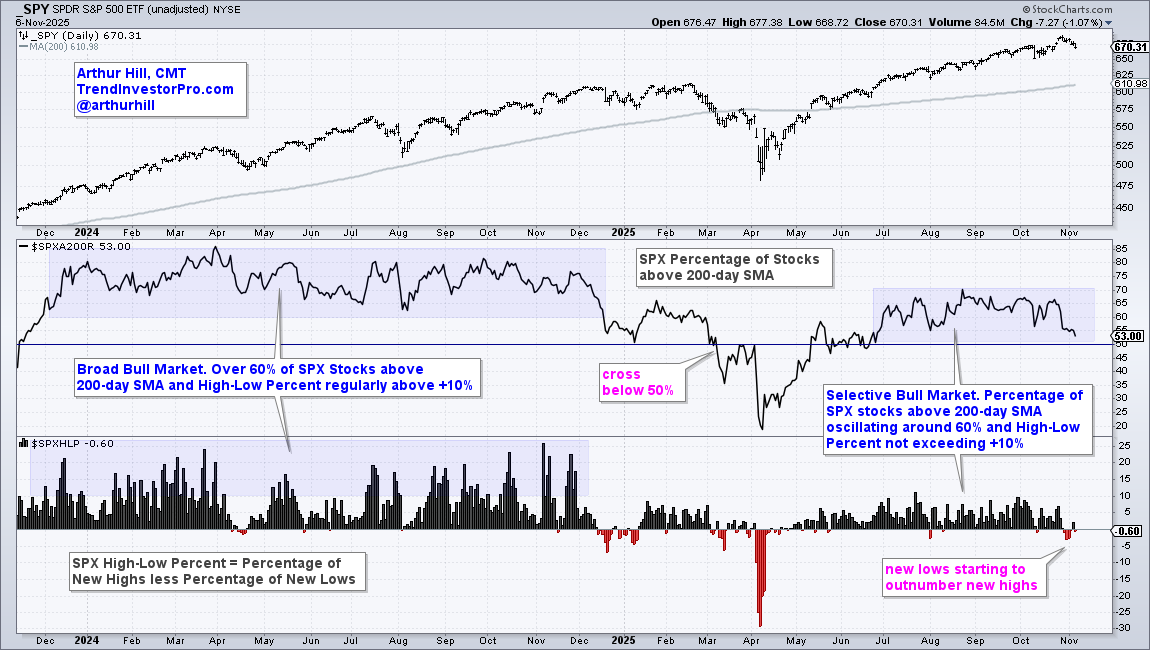
The bottom window shows S&P 500 High-Low% ($SPXHLP), which is the percentage of new highs less the percentage of new lows. New lows started outnumbering new highs over the last six days as this indicator turned negative. Stocks hitting 52-week highs are in strong uptrends and leading, while stocks hitting 52-week lows are in strong downtrends. Negative High-Low Percent values mean more stocks are in strong downtrends than strong uptrends.
One Sector Stands Above the Rest
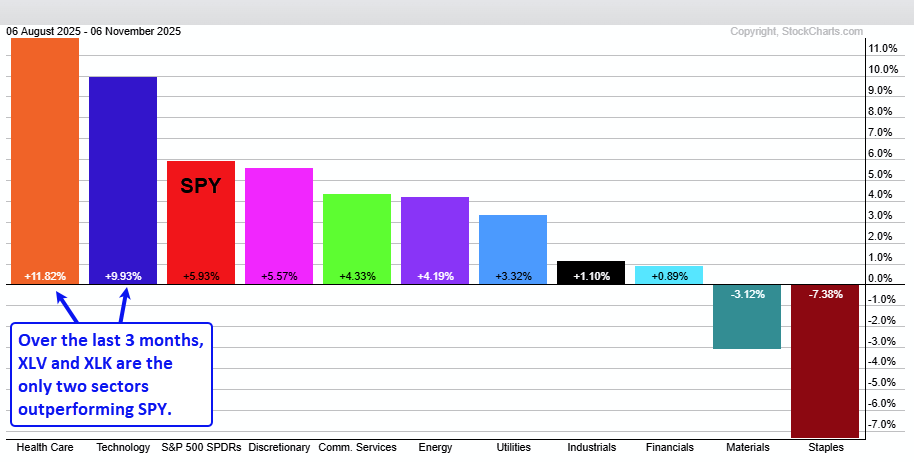
Despite deterioration within the S&P 500, one sector stands out with improving performance. On a three-month basis, the Health Care Select Sector SPDR (XLV) is the best-performing sector with an 11.82% gain. The Technology Select Sector SPDR (XLK) is second with a 10% gain. These are the only two sectors outperforming SPY, which is up 6%. The other eight sectors are underperforming SPY. Talk about a selective market.
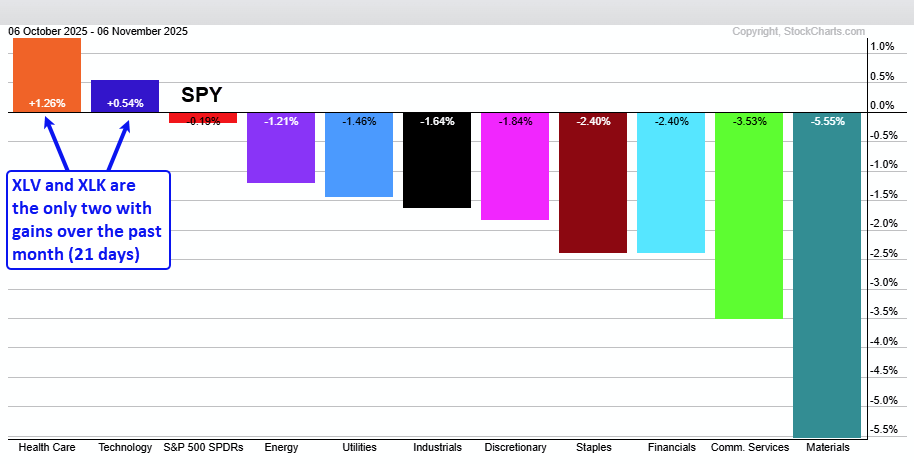
The next PerfChart shows 1-month performance (21-day Rate-of-Change). Again, XLV and XLK are the leaders, and the only two showing gains. SPY and the other nine sectors are down. XLC (-3.53%) and XLB (-5.55%) led the way lower.
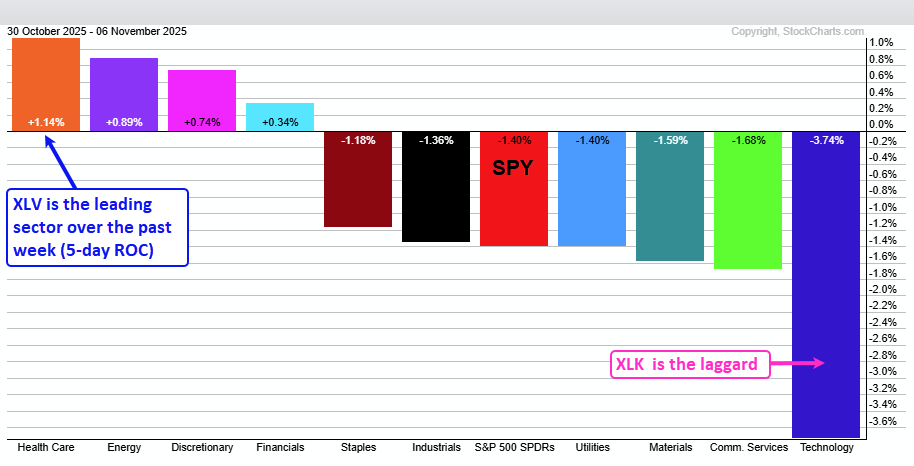
On a one-week basis (5-day ROC), XLV is also leading with a 1.14% gain. XLV is leading on the 3-month, 1-month and 1-week timeframes. It is also the only sector showing gains over these three timeframes. Health Care stands head and shoulders above the rest.
Health Care Shows Internal Improvement as Well
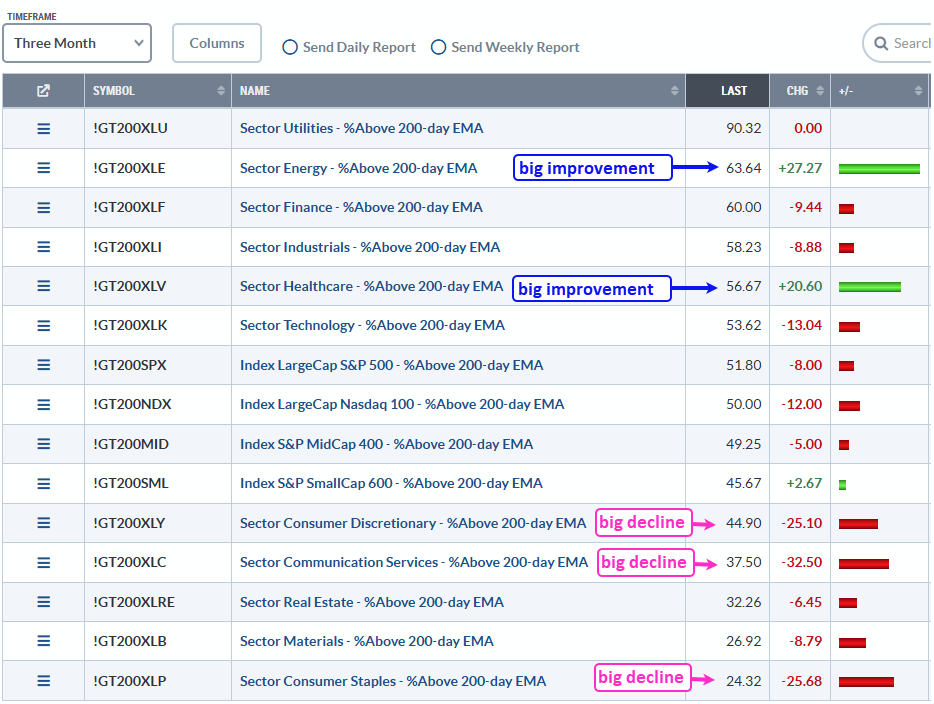
The next table shows the percentage of stocks above their 200-day EMAs for the major indexes and 11 sectors. Utilities is the top performer with some 90% of component stocks above their 200-day EMAs. Energy is a distant second with 63.64%, and also had the biggest 3-month change (+27.27). This means XLE %Above 200-day EMA (!GT200XLE) moved from 36.37% to 63.64%. Health Care also stands out because XLV %Above 200-day EMA (!GT200XLV) was up 20.60 over the last three months.
Recent reports and videos at TrendInvestorPro
- Consumer Staples SPDR Hits Oversold Extreme
- Healthcare SPDR Leads as Utilities SPDR Corrects within Uptrend
- A Leading Aerospace Stock with a Bullish Continuation Pattern
- Gold and Gold Miners Form Bullish Setups in Leading Uptrends
- T-Bond ETF Tests Breakout Zone with Oversold Reading
- Healthcare SPDR Extends on Breakouts
- Click here to take a trial and gain immediate access.
Health Care SPDR Extends on Breakouts
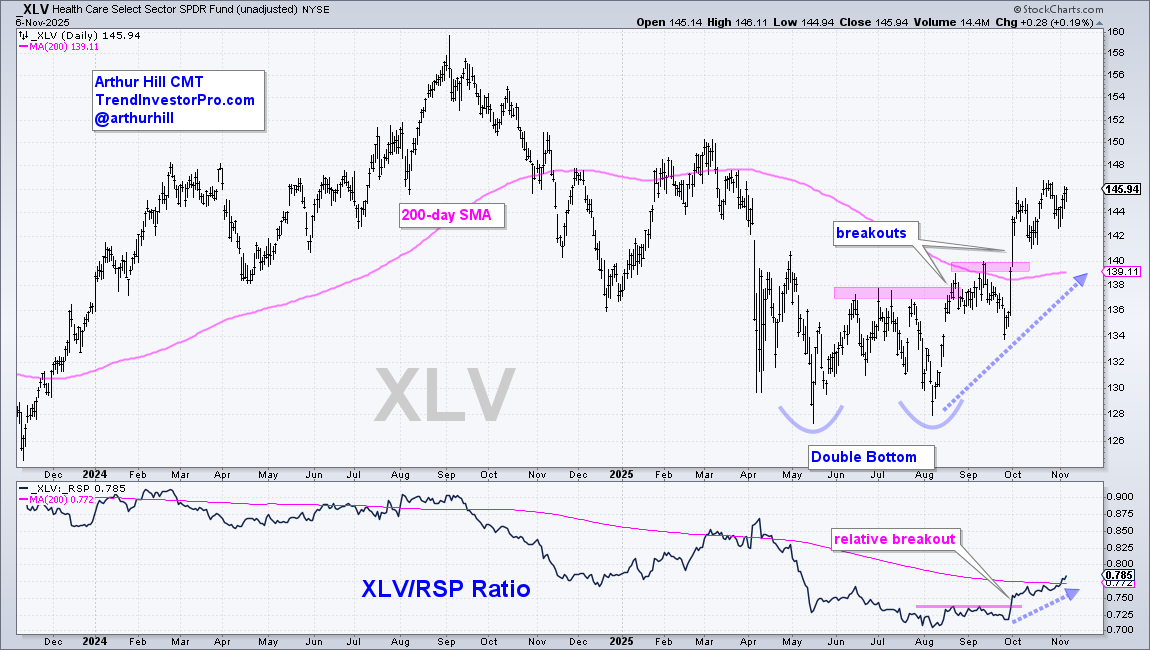
The next chart shows XLV broke a Double Bottom resistance in late August and its mid September high with a surge above 140 — that's two breakouts. XLV is above the 200-day SMA, and this key moving average turned up over the last few weeks. The indicator window shows the price-relative (XLV/RSP ratio) breaking resistance in late September and crossing above the 200-day SMA this week. This means XLV is outperforming the broader market (S&P 500 EW ETF (RSP)). Healthcare-related ETFs and stocks should be at the top of our list for trading setups and trend signals.
EW Consumer Discretionary is the Culprit
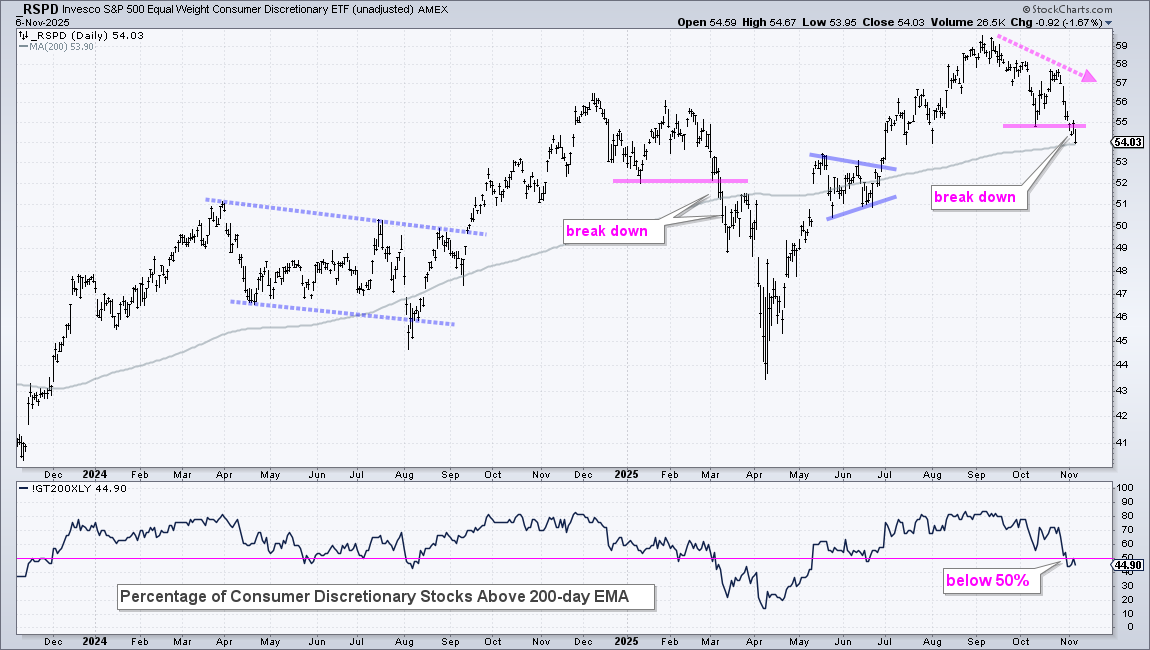
The EW Consumer Discretionary ETF (RSPD) represents the most economically sensitive stocks in the S&P 500, and this key group is leading the market lower. This sector includes housing, retail, and restaurants. As SPY and QQQ moved to new highs in September–October, RSPD peaked in early September and broke its mid-October low this week. A similar breakdown occurred in early March. The indicator window shows Consumer Discretionary %Above 200-day EMA (!GT200XLY) falling from 84% in early September to 44.9% in early November. The majority of Consumer Discretionary stocks are in long-term downtrends. This is negative for the broader market.
As noted last week, it ain't over until the Q's sing, and they started singing this week. The call is not for a bear market as our breadth models remain net bullish and yield spreads have yet to significantly widen. We are monitoring the situation closely because a "momentum of momentum" indicator triggered bearish for SPY and QQQ this week. This argues for a pullback or correction in the two leaders. We covered this signal in our Premium reports.
See TrendInvestorPro for Premium Content


