It’s All Relative: What the RRG View Tells Us About Q4

Key Takeaways
- With fewer economic data points on tap, traders turn to price action for macro clues
- Momentum matters greatly with the fourth quarter now underway, and the RRG relative rotation graph offers insights into what’s working and what’s not
- I highlight the leaders and emerging sector strength, along with the DJIA “Four Horsemen”
Well, that’s all we’ll get. This morning’s disappointing ADP Private Employment report told us what we already knew: the labor market is soft. The stall-speed jobs situation increased the chance of another quarter-point rate cut on the 29th, and Fed funds futures point to a total of three eases this year. Upcoming official data is now on hold as the federal government shuts down for the first time in nearly seven years.
Markets Steady, Bulls Step Into Q4
Stocks were precisely unchanged compared to immediately before the 8:15 a.m. ET ADP data crossed the wires. Treasury yields fell, and the U.S. Dollar Index ($DXY) shed modest ground. The mere flip of a calendar page means little to traders, and the bulls enter Q4 on their front foot, despite some red on the screen today.
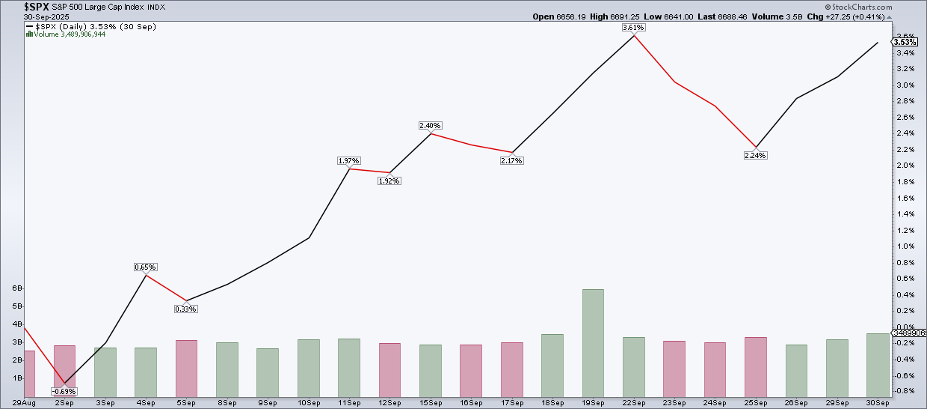
The S&P 500 ($SPX) gained 3.5% last month, the best September return since 2010. Ryan Detrick of Carson Group points out that stocks tend to wobble in October following a strong September and 10%-plus year-to-date return through Q3. That’s something to watch in the weeks ahead.
The past is rarely a precise prologue, of course, but the historical cadence suggests bullish trends in November and December. I suspect that may play out. Call it the “performance chase,” and, as Christmas decorations are already laid out at big-box stores and wholesale clubs, we’ll soon hear about the "Santa Claus Rally.” (Although the SCR doesn’t technically begin until the final week of the year.)
RRG Signals: Health Care Makes a Comeback
In the here and now, what areas might do best in October? I’d encourage investors to heed what StockCharts’ Relative Rotation Graph (RRG) signals. Through September 30, the leading sectors are Communication Services (XLC) and Consumer Discretionary (XLY). Those could be your best bets from a pure momentum perspective.
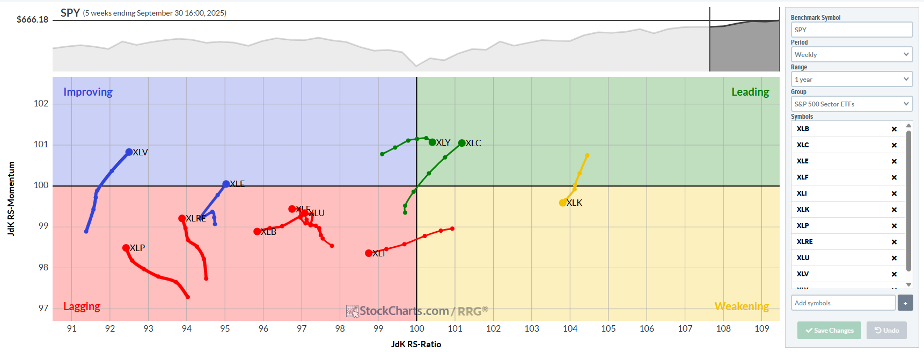
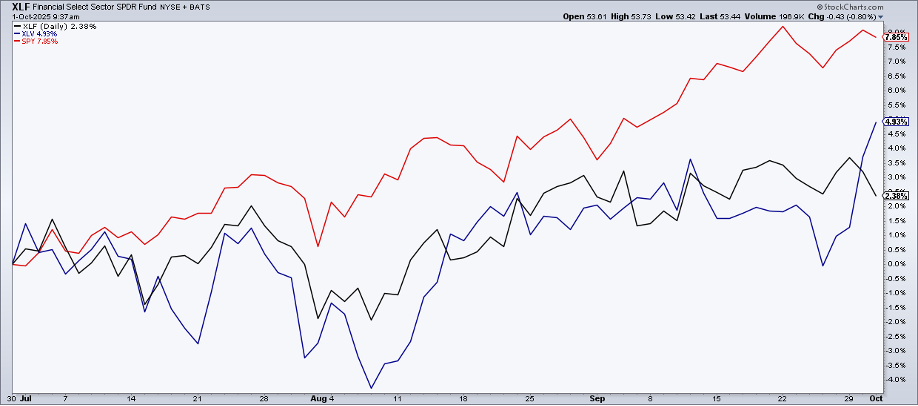
On my radar in the “bounce-back” category is Health Care (XLV). The RRG picture portrays the area of big pharma, biotech, and healthcare providers in a more favorable light compared to a month ago. Would you believe that XLV actually outperformed the in-favor Financials sector ETF (XLF) in both September and Q3? It did.
Shares of Eli Lilly (LLY), the largest stock in the sector, are off the lows, while UnitedHealth Group (UNH) is up almost 50% from its early August multi-year nadir.
Another way to play the defensive Health Care space is via a more risk-on small-cap angle. The Invesco S&P SmallCap Health Care ETF (PSCH) has tread water versus XLV since March. To be clear, PSCH is based on the S&P SmallCap 600 Health Care Index; unlike Russell 2000 small caps, the S&P index has a profitability screen. So, it’s a somewhat higher-quality fund.
Still, small-cap Health Care is more than a quarter comprised of often-riskier biotech stocks. Biotech, along with domestic regional banks, is commonly seen as a key beneficiary of lower borrowing costs. Thus, if we do get a pair of Fed rate cuts, PSCH could perk up.
Health Care’s vital signs are “improving” on the RRG chart. So too is Energy (XLE). Its JdK RS-Momentum reading just recently crept above 100—a bullish move.
Energy's Choppy Outlook
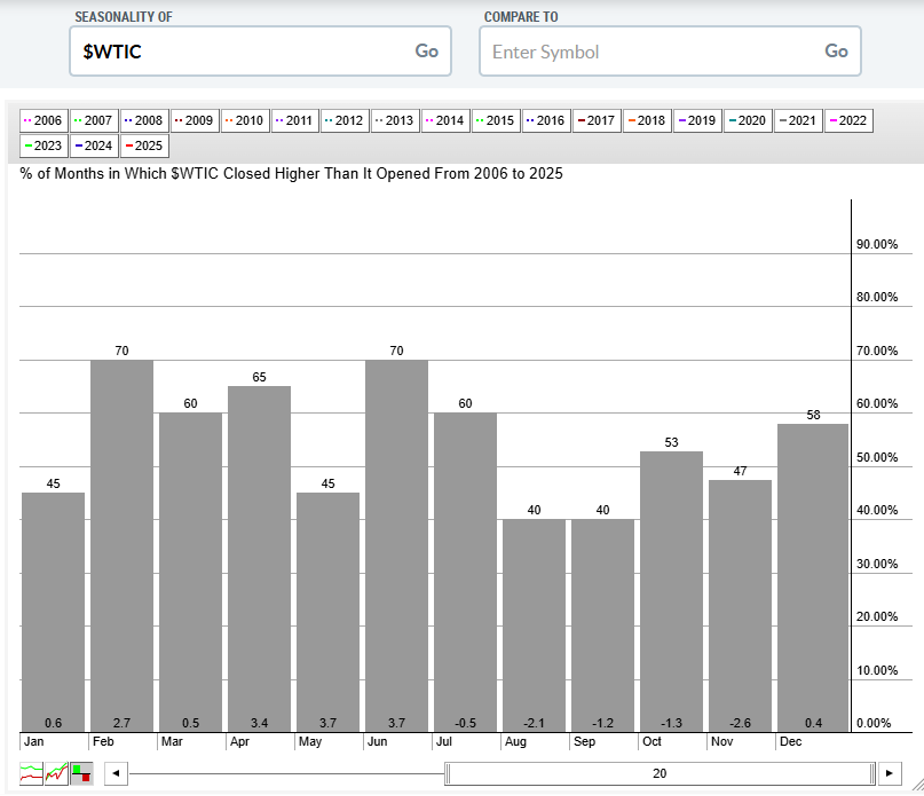
The oil and gas niche is a show-me story, in my view. WTI crude oil has been weak for most of the year (save for a week or two in May around the Israel-Iran conflict). Each time U.S. oil tags the mid-$60s per barrel, the bears seem to come out of the woodwork.
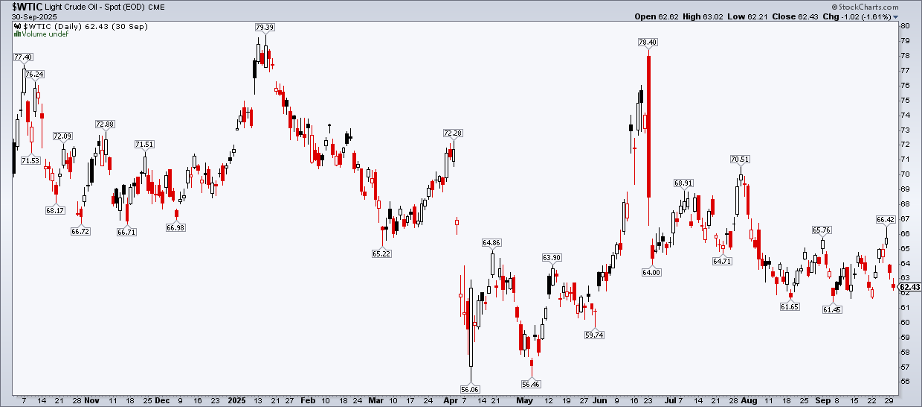
Furthermore, October and November have been notoriously weak for black gold. According to StockCharts’ Seasonality view, WTI has averaged declines of 1.3% and 2.6% in October and November, respectively. So it may be worth underweighting Energy in the short term.
Industrials: A Mixed Bag
Industrials (XLI) remains on my radar. I called out the cyclical-value sector as a potential Q4 winner a few weeks ago. It bottomed relative to the S&P 500 ETF (SPY) on September 17, just before the Fed meeting. But with sub-100 readings on both the JdK RS-Ratio and the JdK RS-Momentum metric, it’s difficult to be all that optimistic.
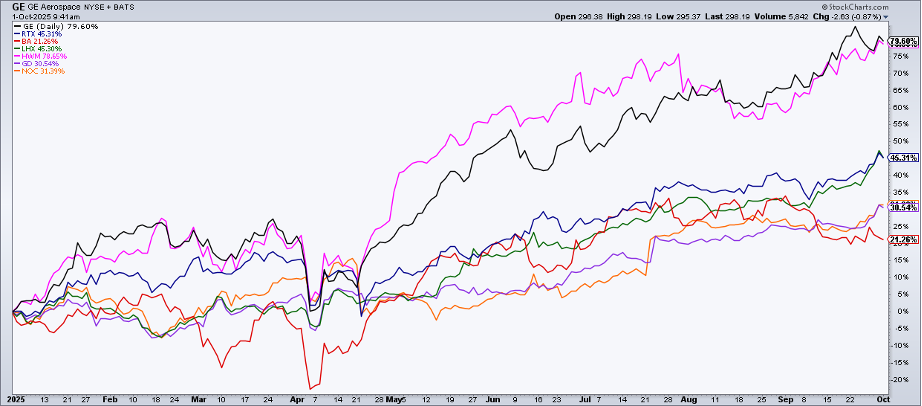
Zooming in on Industrials, aerospace & defense stocks boast alpha. The list of S&P 500 52-week highs is currently littered with these defense names.
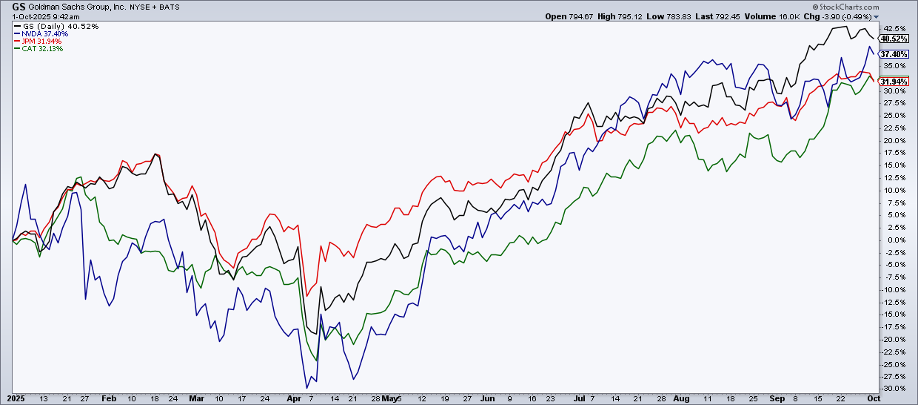
Also, among the best stocks in the market entering Q4 is one of what I’m calling the Four Horsemen of the Dow Jones Industrial Average. Caterpillar (CAT) logged a record high on September 30, macro risks notwithstanding.
Up 33% year-to-date, the Texas-based blue chip has seen its shares plow upward. Be on the lookout for what CAT executives have to say when it reports Q3 results on the morning of October 29, the same day as the Fed meeting.
The Bottom Line
RRG charts provide a quick, yet telling glimpse into what’s working and what's not in the stock market. I assert that it’s even more valuable heading into year-end, given the potential for a performance chase among active managers and possible tax-loss selling in underperforming areas before December 31. As the government shutdown endures, paying attention to price action is more crucial than usual.
Disclaimer: This blog is for educational purposes only and should not be construed as financial advice. The ideas and strategies should never be used without first assessing your own personal and financial situation, or without consulting a financial professional.


