QQQ Channels Higher, 5 Healthcare Leaders, How to Trade Pullbacks: Case Study and Current Signal

Welcome to the Friday Chart Fix!
Today's report starts with the leading uptrend in QQQ. Large-cap tech stocks may seem ripe for a correction, but there are no signs of weakness on the price chart. Even though QQQ and the MAG7 are leading, there is strength in other areas, with five healthcare stocks outperforming six of the MAG7. This report concludes with a case study on finding and trading bullish setups within long-term uptrends. We will then apply these lessons to Microsoft and show how to manage the trade after the signal.
Key Takeaways
- QQQ channels higher with steady advance
- Five healthcare stocks outperforming six of the MAG7 stocks
- Robotics AI ETF is displaying a bull flag
- Microsoft breaks out after a pullback
QQQ Channels Higher with Steady Advance
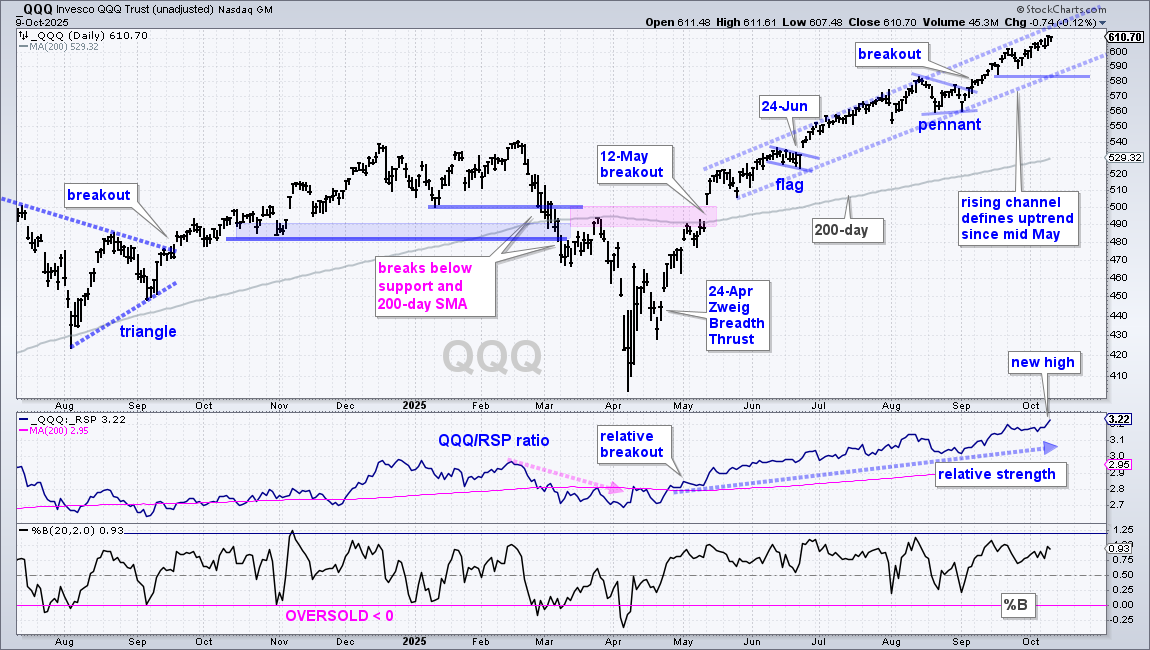
The Nasdaq 100 ETF (QQQ) remains a leader with new highs in price and the relative strength line. The chart below shows the transition from downtrend in early March to uptrend with the May 12th breakout. Since the surge above 520 in mid-May, the ETF worked its way higher with a series of shallow pullbacks and new highs. A tight rising channel defines this steady advance with support marked at 580. Until QQQ breaks 580, the trend is up and strong with no signs of correction. The middle window shows the relative strength line (QQQ/RSP ratio) breaking above its 200-day in late April and trending higher the last 5+ months.
Five Healthcare Stocks Outperforming Six of the MAG7
NVIDIA (NVDA) is the clear leader within the MAG7 this year, with a 40+ percent year-to-date gain. However, performance for the other six is mixed. Apple (AAPL), Tesla (TSLA), and Amazon.com (AMZN) are the laggards this year with sub-10-percent gains. Meta (META), Microsoft (MSFT), and Alphabet (GOOGL) are neck-in-neck with respectable gains in the 23–28 percent range. Despite these stocks getting most of the soundbites, over 80 stocks in the S&P 500 have bigger year-to-date gains (> 29%).
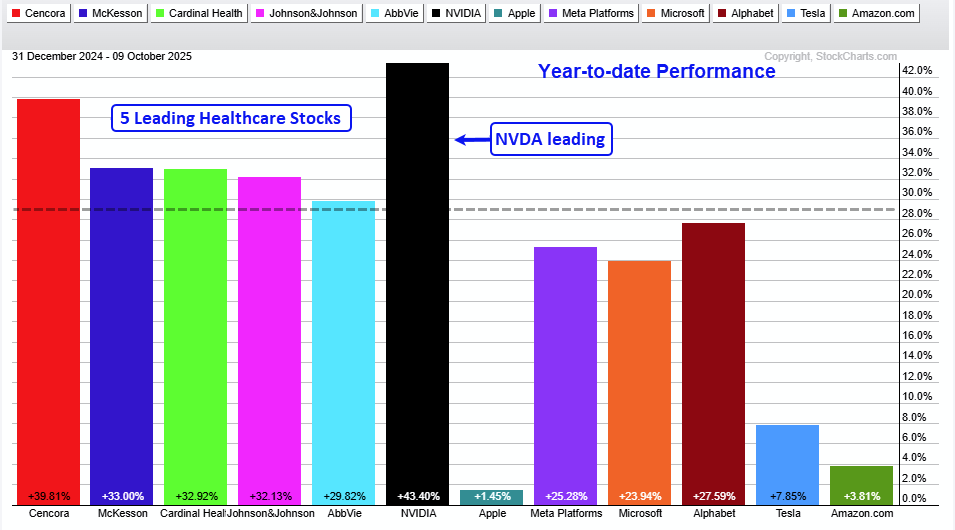
A scan through the charts shows five healthcare stocks with market-leading gains and relative strength this year. Note that healthcare came to life the last few weeks as the Healthcare SPDR (XLV) broke out with a big surge. Cencora (COR), McKesson (MCK), Cardinal Health (CAH), Johnson & Johnson (JNJ), and AbbVie (ABBV) are all up more than 29% and outperforming six of the seven MAG7 stocks. The lessons here: it is a stock-pickers' market. Cast a wide net for setups because there are leaders outside of tech and the MAG7.
This week at TrendInvestorPro, we featured setups in Cencore, Cardinal Health, and two biotech stocks.
Recent reports and videos at TrendInvestorPro:
- How to Trade Parabolic Moves in Silver and Gold Miners
- Four Healthcare Stocks with Bullish Setups (CAH, COR and two biotechs)
- Small-Caps, Mid-Caps and Regional Banks are Lagging
- XLI Breaks Out, XLU Hits New High and IFRA Extends
- Trailing Stops for 10 Tech-Related ETFs
Click here to take a trial and gain full access.
Case Study: Bull Flag in Robotics AI ETF
Several tech-related ETFs set up in August as they consolidated or pulled back within long-term uptrends. TrendInvestorPro featured the Robotics AI ETF (ARTY) on August 26 as a falling flag formed and %B became oversold.
Let's dive into the setup, signal, and stop behind this trading strategy. Foremost, the long-term trend was up with a new high in late July and price well above the rising 200-day SMA. This means pullbacks and short-term oversold conditions present opportunities to trade in the direction of the long-term uptrend. Second, a falling flag formed in August and %B became oversold. Falling flags are short-term bullish continuation patterns that represent small corrections within the uptrend.
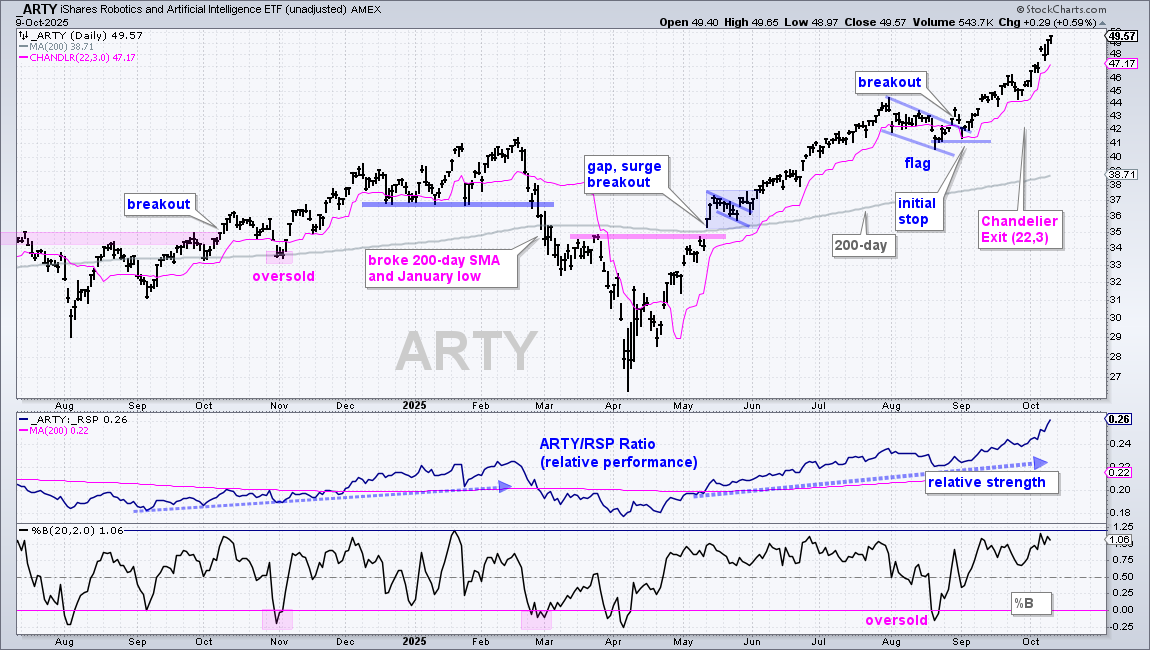
In the bottom window, %B became oversold with a move below zero, which means the close was below the lower Bollinger Band (20,2). Short-term oversold conditions alert traders to pullbacks within an uptrend.
Third, the flag provides traders with a signal level to watch for a breakout. ARTY triggered this signal with a flag breakout in late August. Once triggered, the closing low of the flag becomes first support for the initial stop (blue line at 41). With ATRY continuing higher into September, traders could consider a trailing stop, such as the Chandelier Exit (22,3). This stop is 3 ATR(22) values below the 22-day high; it trails price and rises as long as price rises. TrendInvestorPro specializes in setups and follow-ups like this.
Microsoft Breaks Out After Pullback (Now What?)
Now let's apply this trading strategy to MSFT, which recently broke out. First and foremost, MSFT is in a leading uptrend with a new high in August and price is well above the rising 200-day SMA. The price-relative (MSFT/RSP ratio) is also in an uptrend, which means MSFT is outperforming the broader market. Second, the stock corrected with a falling wedge into early September and became moderately oversold. As with the falling flag, this is a bullish continuation pattern that represents a correction within the bigger uptrend.
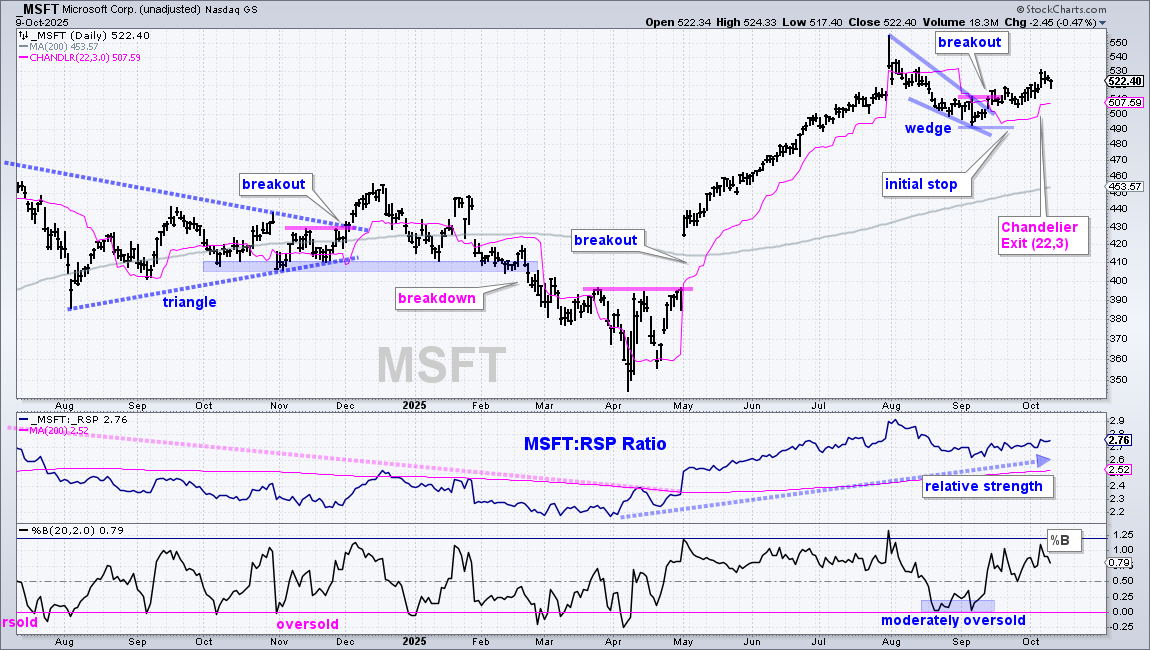
In the bottom window, %B did not dip below zero, but came pretty close to becoming "moderately oversold", as opposed to truly oversold. Third, MSFT triggered a signal with a breakout pop on September 15th. Now is the time to manage the signal/trade. The falling wedge low marks first support for the initial stop-loss (490). With the stock continuing higher into early October, we can now consider a trailing stop. For reference, the pink line shows the Chandelier Exit (22,3) at 507.59.
See TrendInvestorPro for more chart analysis and videos.


