QQQ/SPY Targets, IWM Best Hold, NDX Dominance Quantified, Bitcoin/QQQ Relationship, Costco Holds Up

Welcome to your Friday Chart Fix. Signs of correction and rotation emerged this week as money moved out of tech-related groups and into defensive groups. In this article, we will put this week's rotation into perspective with some year-to-date performance metrics.
Nasdaq 100 stocks are a dominant force and leading lower as NDX %Above 50-day SMA dips below 50%. QQQ is moving into correction mode and taking SPY along for the ride. IWM held up relatively well in August, but small-caps are still underperforming this year. Within the Nasdaq 100, Costco is holding up relatively well in August, with a short-term breakout working. Today's report ends with support levels for Bitcoin and its relationship with QQQ.
Note: This post was written before Fed Chairman Powell's speech, which sent stocks higher and small-caps soaring. We shall see how the market closes. Despite these big moves, the odds still favor a correction in the high-flying tech ETFs (QQQ). The Russell 2000 ETF (IWM) may warrant a reassessment as it moves further above its 200-day SMA.
Key Takeaways
- Signs of correction and rotation emerge on the PerfCharts.
- QQQ became seriously extended in August — a correction would be healthy.
- Corrections are unpredictable, but we can offer some target zones.
- Nasdaq 100 stocks dominate the S&P 500; here are some numbers.
Signs of Correction/Rotation Emerge
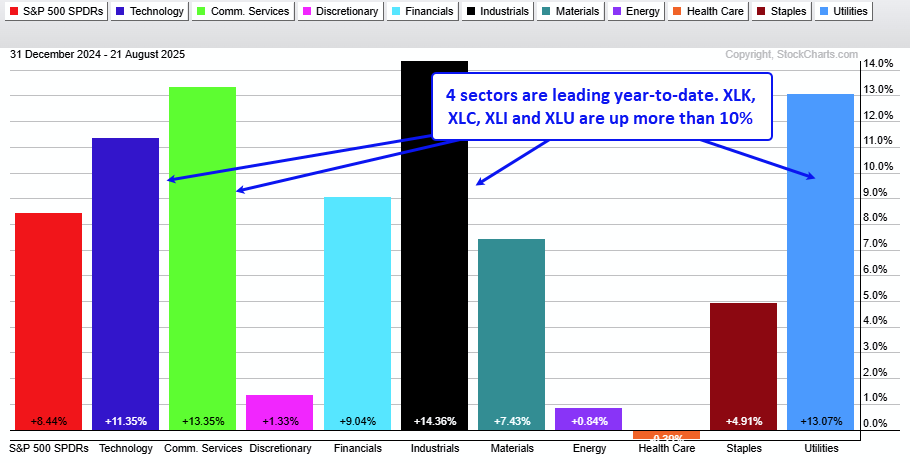
The first PerfChart shows year-to-date performance for the 11 sectors. Four are leading with double-digit gains: Technology (XLK), Communication Services (XLC), Industrials (XLI), and Utilities (XLU). Healthcare (XLV) is the weakest sector this year with a 0.39% loss.
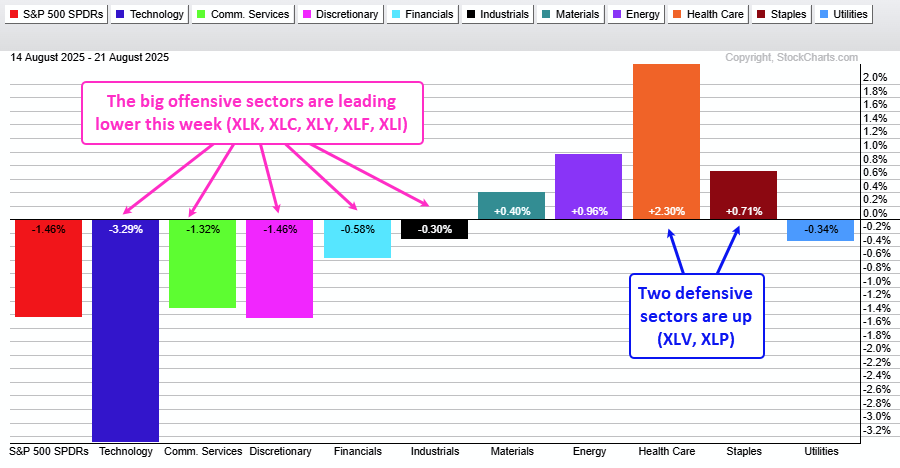
The recent rotation becomes evident when looking at the one-week performance. The five offensive sectors are down, with Technology (-3.29%) leading the way. Two defensive sectors are up, with gains in Healthcare (+2.30%) and Staples (+0.70%). This week, TrendInvestorPro covered XLK correction targets and recent breakouts in some defensive names.
QQQ Could Return to the Prior Highs
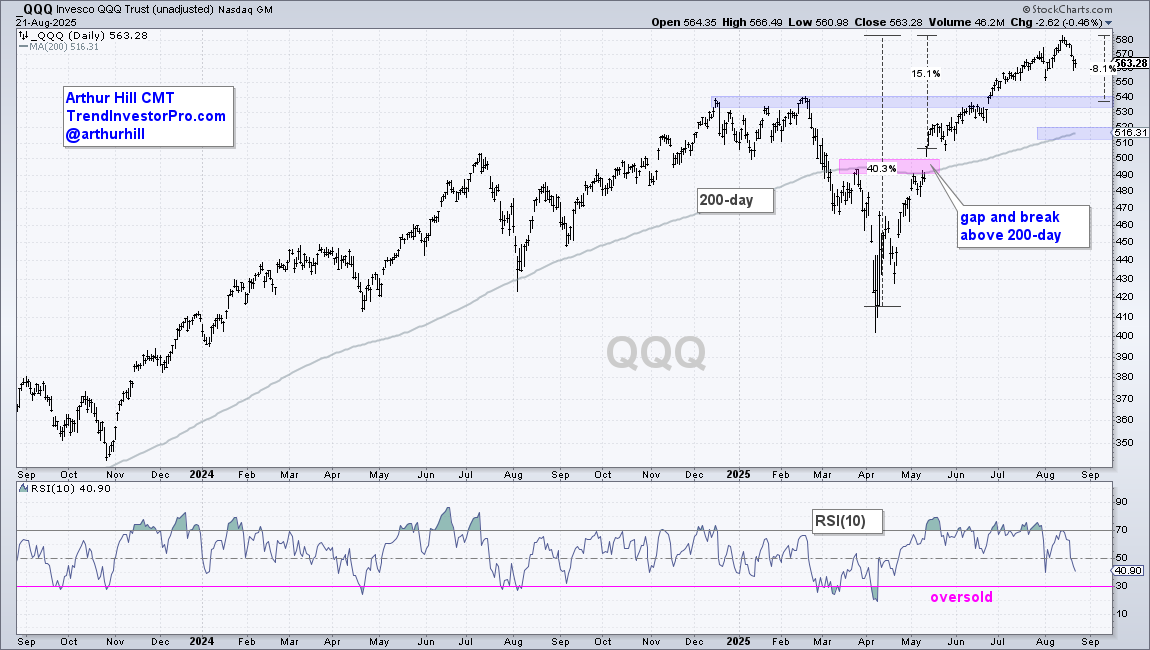
QQQ remains in a long-term uptrend, with a new high in August and price well above the 200-day SMA. However, the ETF became seriously extended after a 40% advance off the April closing low and a 15% gain since the May breakout. A correction at this stage would be perfectly normal. Broken resistance turns support for the first target in the 540 area. A garden variety 8% decline would carry QQQ to 538. Further down, we have the rising 200-day in the 516 area. The indicator window shows that RSI(10) has yet to become oversold with a move below 30.
Recent reports and videos at TrendInvestorPro:
- A 93 Day Streak for SPY – and counting
- Comparing March-August 2020 with March-August 2025
- Defensive ETFs Break Out as Tech ETFs Stumble
- Gold and Silver Wind up as Bonds Brace for Jackson Hole.
Click here to learn about subscriber bonuses and a trial offer.
Corrections Are Like a Box of Chocolates
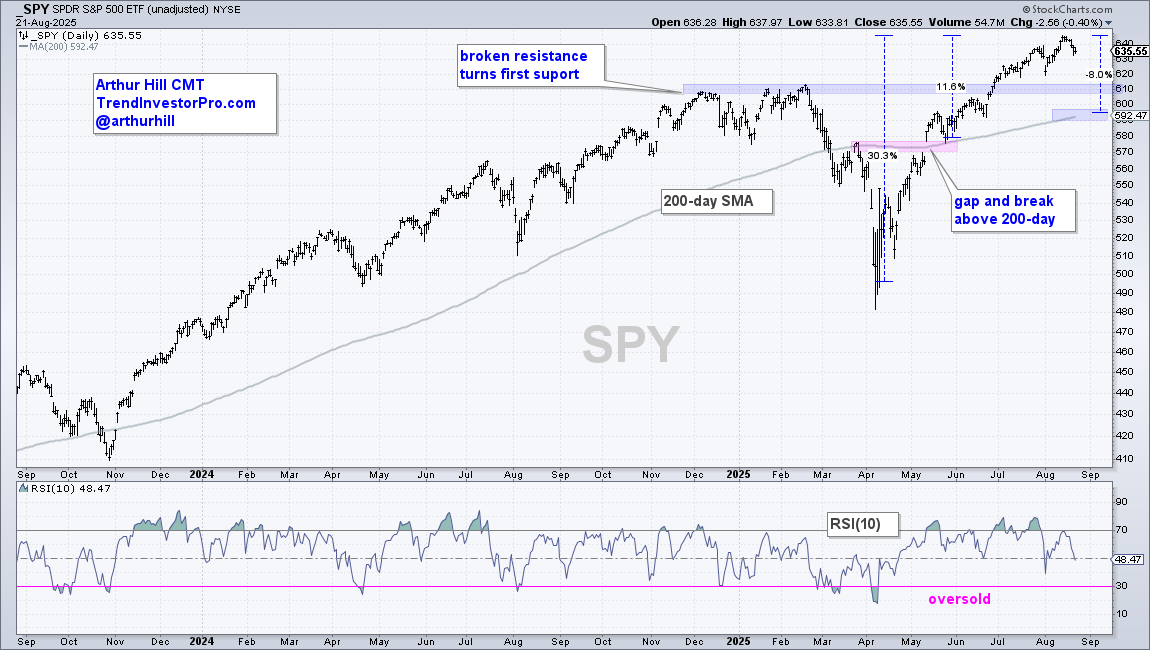
The next chart shows SPY with similar characteristics. A correction back to broken resistance would extend to the 610 area, while a correction back to the rising 200-day would extend to the 590-600 area. Keep in mind that corrections are like a box of chocolates: you never know what you are going to get. With the long-term trend still up, pullbacks are viewed as corrections within the bigger uptrend, and these are opportunities to trade within the bigger uptrend. Truth be told, we do not know how long the correction will last, how far it will extend, or what shape it will take. It is time to exercise some patience and wait for a setup to emerge. I will watch for oversold conditions, signs of firming, and/or a bullish continuation pattern.
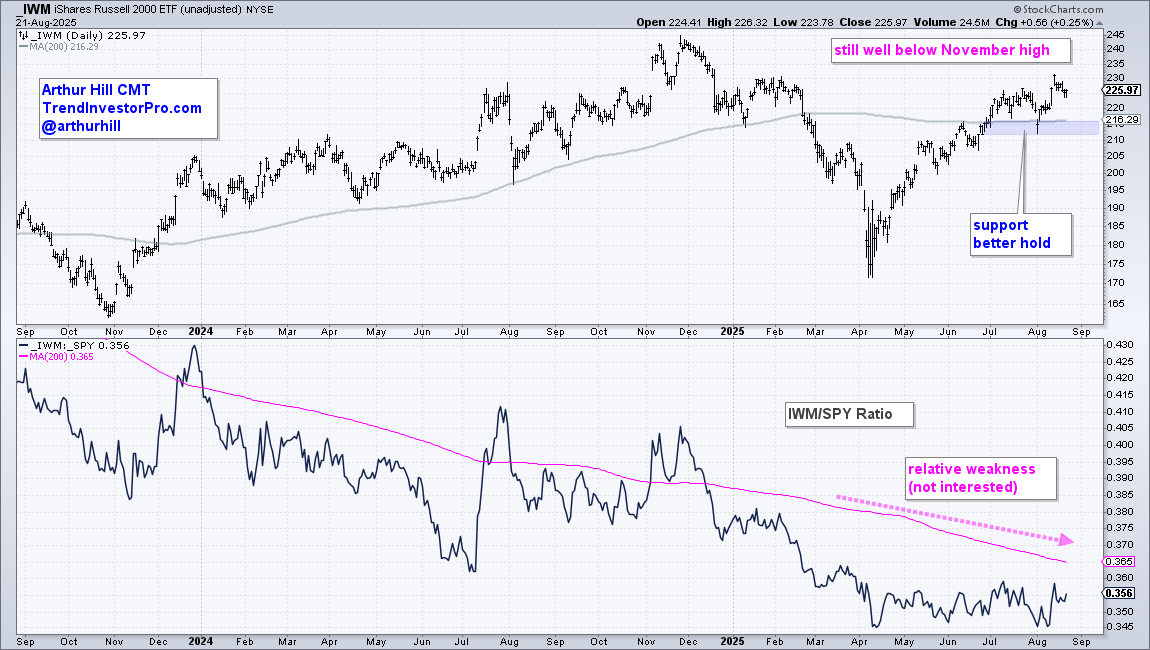
IWM Held Up Short-Term, but Still Lagging Long-Term
The iShares Russell 2000 ETF (IWM) held up relatively well this week, but remains a long-term laggard. While SPY and QQQ recorded new highs this month, IWM is still well below the November high. The bottom window shows price-relative (IWM/SPY ratio) breaking below its 200-day SMA in December and wallowing below this key moving average since April. On the price chart, IWM is still in an uptrend since breaking the 200-day SMA in late June. This breakout better hold; a close below the early August low (blue shading) would be bearish.
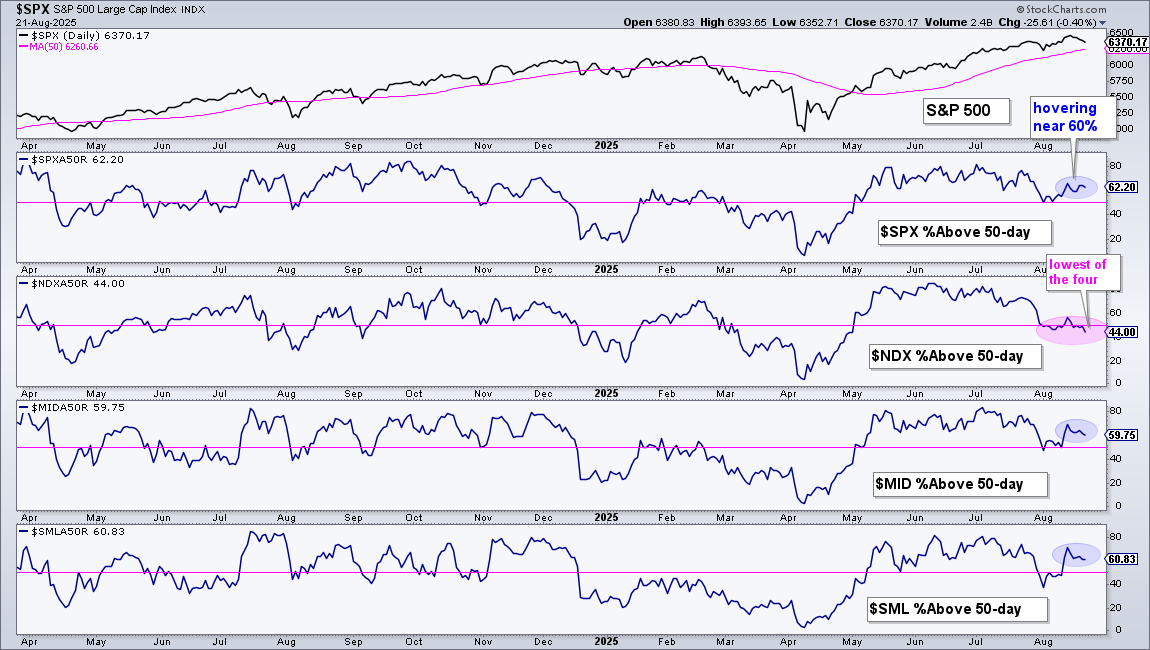
More than Half of NDX Stocks Below their 50-day SMAs
The next chart shows the percentage of stocks above their 50-day SMAs for the S&P 500, Nasdaq 100, S&P MidCap 400, and S&P SmallCap 600. It is clear that Nasdaq 100 stocks bore the brunt of selling pressure since July. NDX %Above 50-day moved below 50% on August 1st, stalled around the 50% line, and dipped to 44% this week. This means 56% of the Nasdaq 100 stocks are below their 50-day SMAs. The other three %Above 50-day SMA indicators are around 60%, which means the Nasdaq 100 shows the most internal weakness.
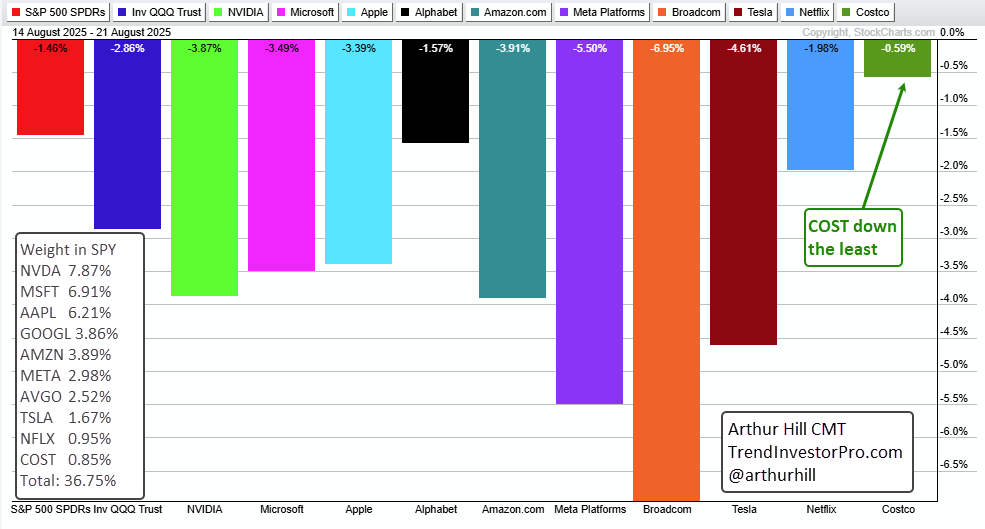
Quantifying the Nasdaq 100 Influence on SPY
The Nasdaq 100 exerts an outsized influence on the S&P 500 SPDR (SPY). First, the Technology SPDR (XLK) is the largest sector and accounts for 33.76% of SPY. Second, 87 of the 500 component stocks in the S&P 500 are also part of the Nasdaq 100. Third, the top 10 Nasdaq 100 stocks account for 36.75% of SPY. The PerfChart below shows the one-week performance for the 10 SPY stocks that are also part of the Nasdaq 100. Seven of the 10 are down more than 3%. Costco (COST) is holding up the best with the smallest loss (-0.59%). No surprise here, as Costco could be a defensive stock (consumer staple).
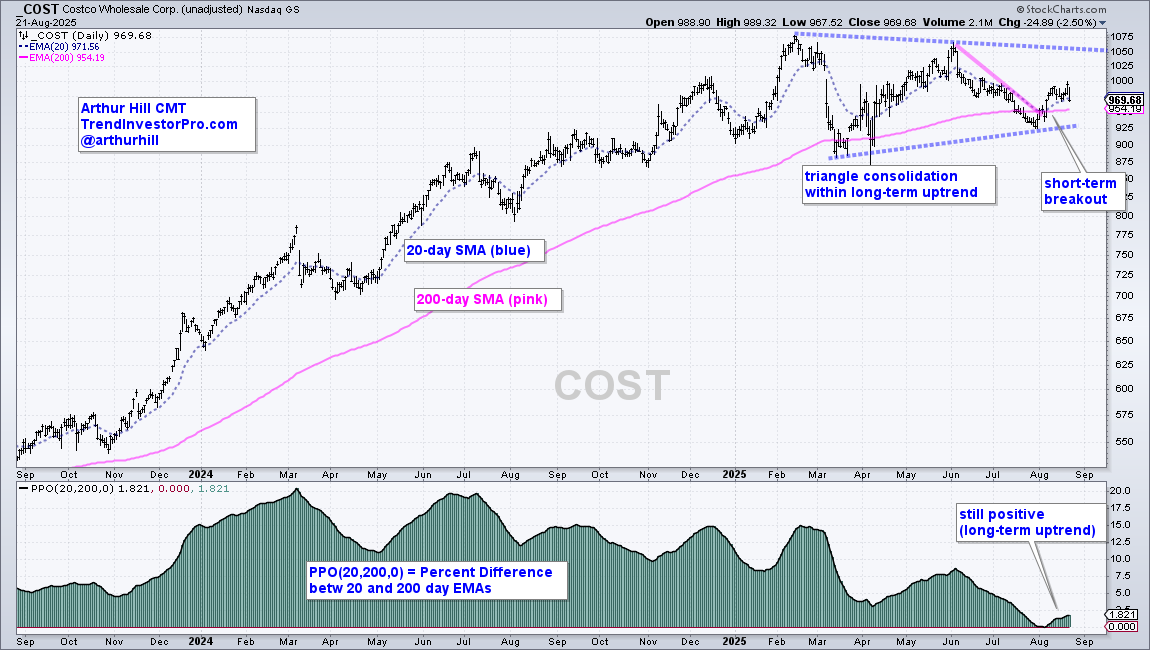
Costco Remains in Long-term Uptrend
The next chart shows Costco (COST) with the 20-day EMA, 200-day EMA, and PPO (20,200,0). Long-term, the 20-day is still above the 200-day, and the PPO is still positive, which means the long-term trend is still up. COST was hit hard on Thursday, but remains within a long-term consolidation (triangle), and the swing within this triangle is up. I view the triangle as a consolidation within the uptrend, which makes it a bullish continuation pattern. A breakout at 1060 would confirm this pattern. Short-term, COST reversed the downswing within this pattern as it broke out in early August. This is the first sign that COST will make a run towards resistance. A close below 925 would negate this setup.
Bitcoin Positively Correlated with QQQ
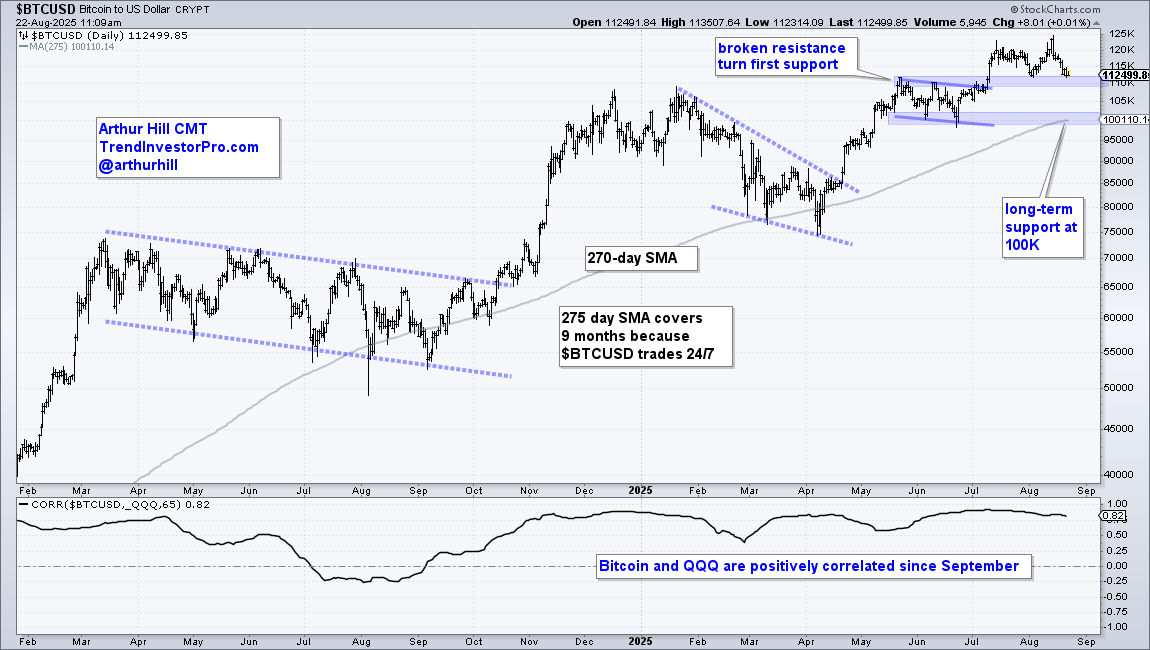
Bitcoin ($BTCUSD) remains in a long-term uptrend with a new high in mid-August and price well above the rising 270-day SMA. Why 270 days? Because Bitcoin trades 24/7 and 270 days covers around 9 months. Bitcoin is testing its first support zone in the 110K area — it broke resistance, turned support, and the late July low. A break here would open the door to long-term support in the 100K area. Here we have the May-June lows and rising moving average. Note that Bitcoin is positively correlated with QQQ, which means these risk assets tend to move in the same direction. We first covered this three weeks ago (here). The bottom window shows the Correlation Coefficient (QQQ,65) above zero since September 2024 and currently at 0.82, which shows a strong positive correlation.
See TrendInvestorPro for more charts and videos.


