Rangebound Market: How to Trade the S&P 500’s Next Move

With a busy week of economic data, earnings releases, and macro themes, the S&P 500 ($SPX) remained decidedly rangebound. We’ve been focused on the long-term consolidation phase that has been in place since the end of October 2025. A closer review of the charts today suggests an update to our key levels of support and resistance as we navigate an eventual resolution to this sideways period.
Today, we’ll show how the recent sideways trend for the S&P 500 fits into a larger theme of leadership rotation from growth into value, and identify some specific technical signals we’re watching for as we get into late February.
Charting a Market in Equilibrium
Starting with a daily chart of the S&P 500 back to the April 2025 market low, we can observe how the acceleration of the lows in April and May eventually slowed into a low-volatility uptrend through the summer of 2025. When the S&P 500 finally broke below the 50-day moving average in November, it signaled a potential change in trend.
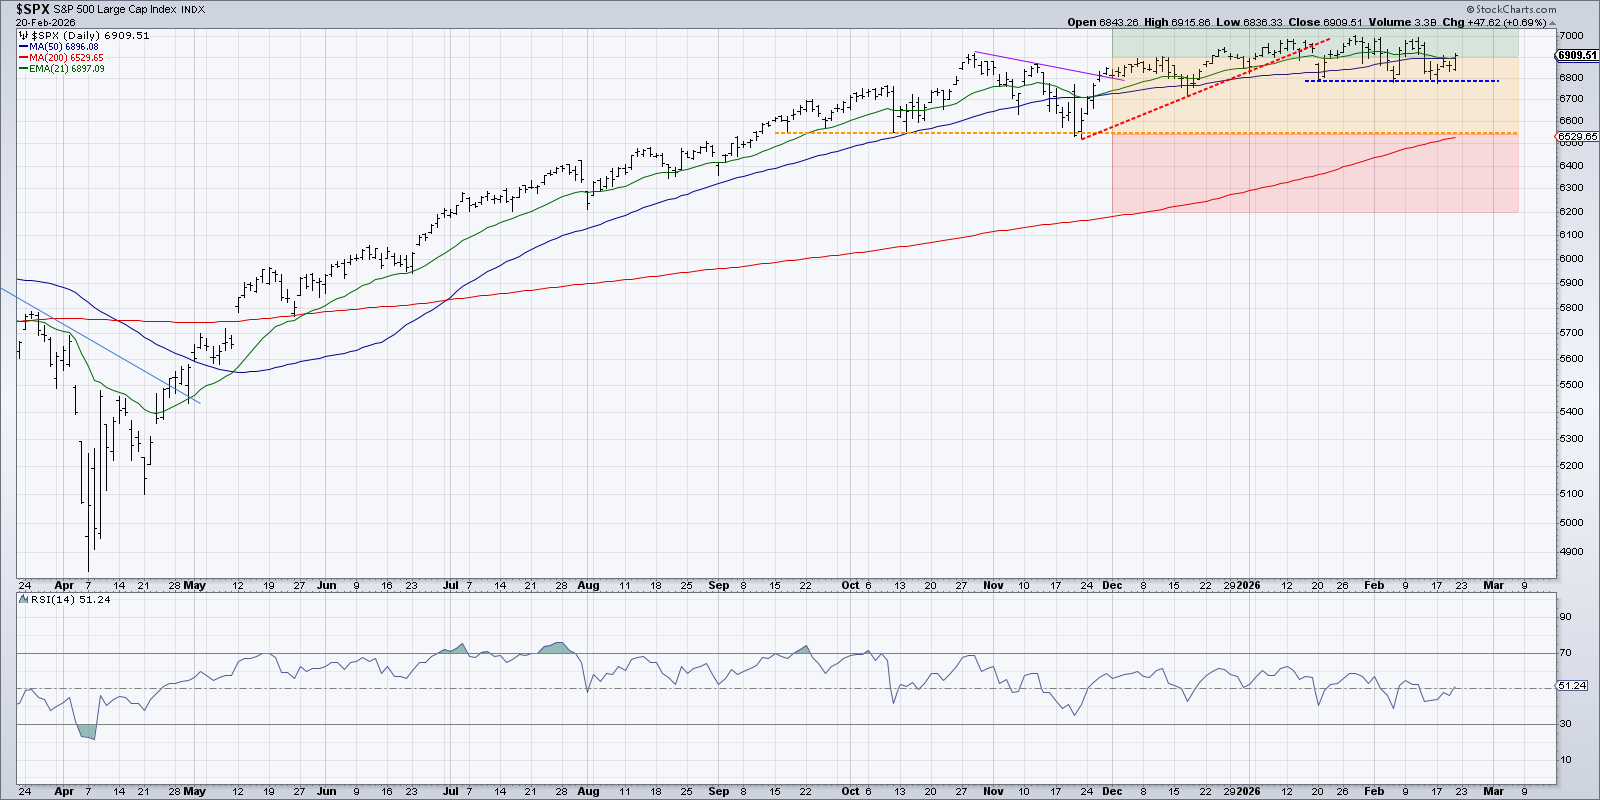
While the 50-day moving average did not hold as support in November, the S&P found support at the previous swing low from mid-October. We can then see a series of trendline breaks, first with an upside breakout around Thanksgiving, followed by a breakdown of trendline support in January.
The S&P 500 finished this week just above 6900, which is exactly where the index was sitting the last week of October. So all the noise and flickering ticks of daily and weekly market moves have resulted in essentially no change to our benchmarks. Indeed, the real action has been under the hood with individual stocks.
Updating the Traffic Light With New Levels
Zooming in on the last six months, we can see the traffic light setup I’ve placed on the chart. We have considered anything above the 6900 level to be bullish, as indicated with the green-shaded area. Any move below key support at 6550 would constitute a major breakdown, with price entering the bearish red-shaded area. Anything in the middle could be considered neutral.
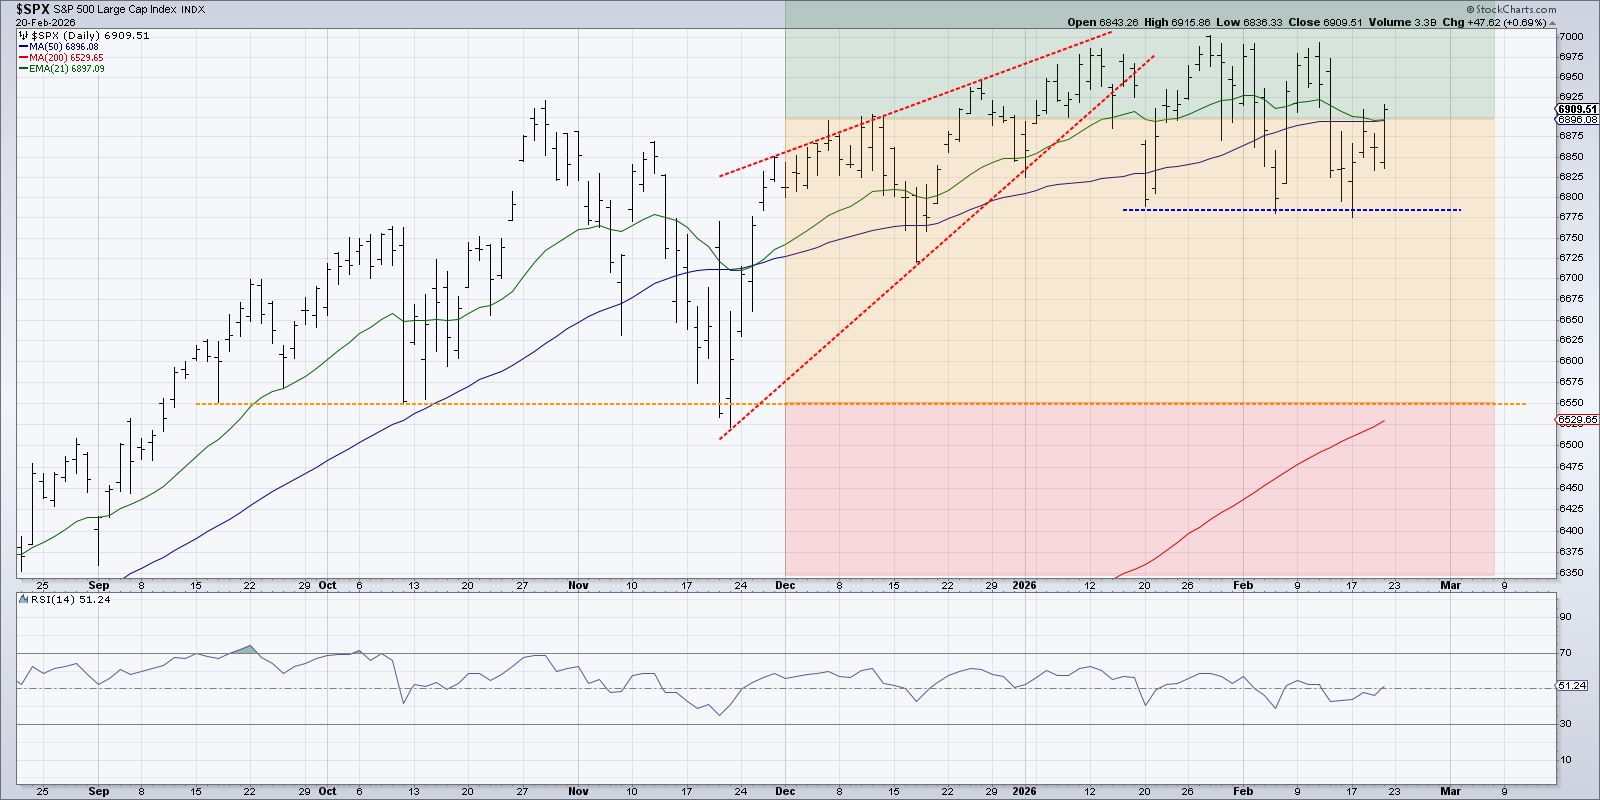
We can also see the rising wedge pattern, indicated with red trendlines, where the S&P 500 was trending higher but with a narrowing range from late November through mid-January. A break below this rising wedge pattern did not result in a dramatic downturn, but rather led to the sideways phase, which remains through this week.
Over the last four weeks, the S&P 500 has appeared to settle into a “range within a range,” with short-term support around 6780 and resistance at the previous all-time high around 7000. With the S&P 500 basically straddling the bullish and neutral areas this week, we have updated our thinking to consider these new short-term levels as key thresholds. A move below 6800 next week would open the door to a retest of the 200-day moving average, where we would anticipate further support.
Using Momentum to Confirm a New Trend
So what tools can we use to validate a potential breakout or breakdown scenario? I would argue that, at this point, it’s all about momentum. While the S&P 500 has remained within a small price range, the RSI has revolved around the 50 level, indicating balanced momentum.
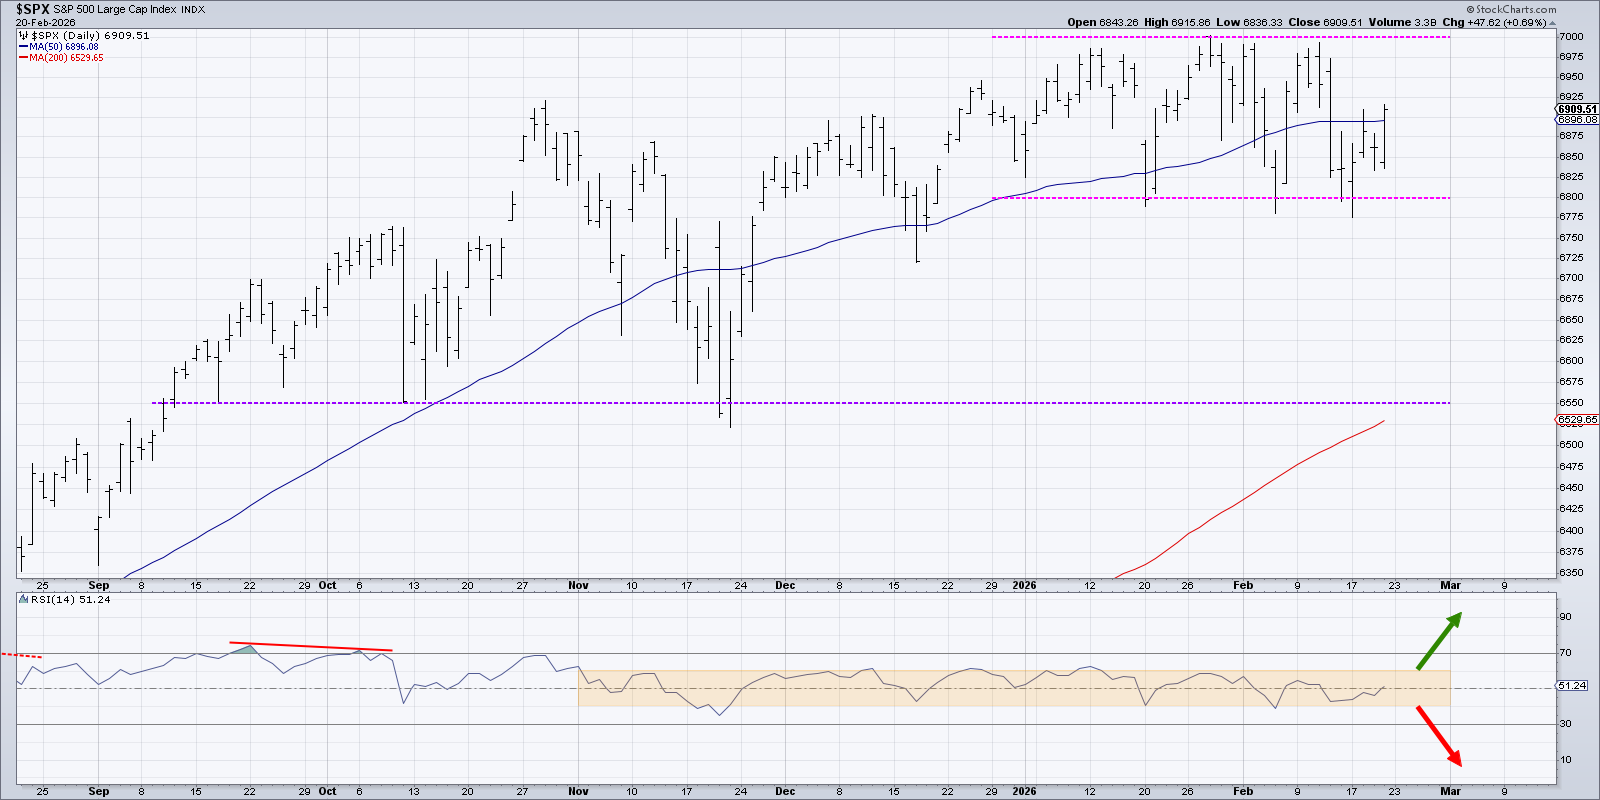
A break above SPX 7000 would need to be confirmed with an RSI above 60. Strong price action supported by improving momentum would imply a high likelihood of further upside as additional buyers join. A break below 6800, however, especially if punctuated with an RSI dropping below 40, would confirm a new downtrend phase and an increased chance of further downside in line with the traditional seasonal patterns of a midterm election year.
At this point, the S&P 500 remains firmly entrenched in a sideways market trend. By watching support and resistance levels, and confirming any shifts in price with appropriate changes in momentum readings, investors should be able to navigate the next big move!
For more on the changing macro conditions and latest earnings updates, along with how they relate to the technical analysis approach we outlined today, check out this recent episode of the Market Misbehavior podcast:
RR#6,
Dave
P.S. Ready to upgrade your investment process? Check out my free behavioral investing course!
David Keller, CMT
President and Chief Strategist
Sierra Alpha Research LLC
marketmisbehavior.com
https://www.youtube.com/c/MarketMisbehavior
Disclaimer: This blog is for educational purposes only and should not be construed as financial advice. The ideas and strategies should never be used without first assessing your own personal and financial situation, or without consulting a financial professional.
The author does not have a position in mentioned securities at the time of publication. Any opinions expressed herein are solely those of the author and do not in any way represent the views or opinions of any other person or entity.