Reading Between the Lines: What RSI and Breadth Are Saying About Stocks

If you’ve been following the S&P 500’s rebound from its April lows, when it was overtaking prior highs and continuing to advance with little meaningful pullback, you may be wondering why we haven’t seen that weekly overbought reading yet.
To put it in perspective, we’ve seen this act out before. Back in 2020–2021, it took a very long time for the Relative Strength Index (RSI) to rise above the 70-level. The index gained nearly 90% before that eventually happened, which was in early 2021, nearly a year after the COVID low.
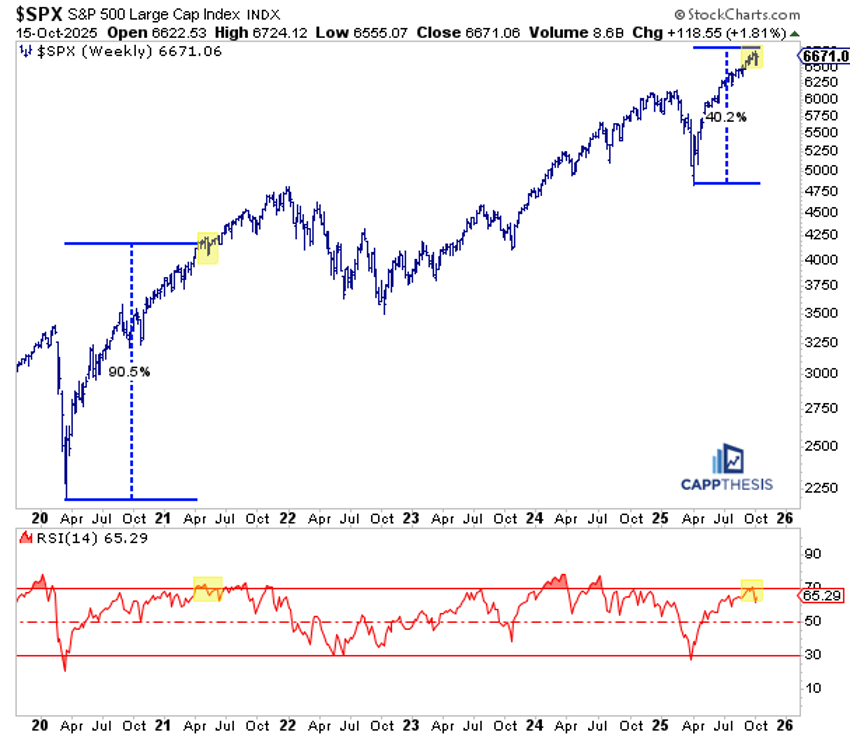
What took so long? One reason was the greater amount of volatility early in the recovery, especially around June 2020 and again in September–October. When the weekly indicator surpassed the 70-threshold, that did not mark the top. The RSI hovered near overbought levels for months, with the market continuing higher before meaningful profit-taking began in early 2022.
Today’s Rally: A Quicker Setup
Fast-forward to today, and the recent weekly overbought signal arrived much sooner (two weeks ago), taking about five months versus nearly a year in the prior cycle. The key difference is that this rally has featured far less back-and-forth movement. This has allowed momentum to build more quickly despite the market being up roughly 40% in a short span.
Now that the overbought condition has eased, it’s important to recognize that this is not a negative: overbought or oversold readings are not static states. What matters more is whether the RSI oscillates between overbought and the midrange while prices trend higher, a classic sign of a strong uptrend.
For reference, during the 2020–2021 advance, the RSI crossed above 50 in April 2020 and stayed there until January 2022, a clear blueprint worth watching again in the current cycle.
The Market’s Breadth: Cumulative Adv-Dec Line
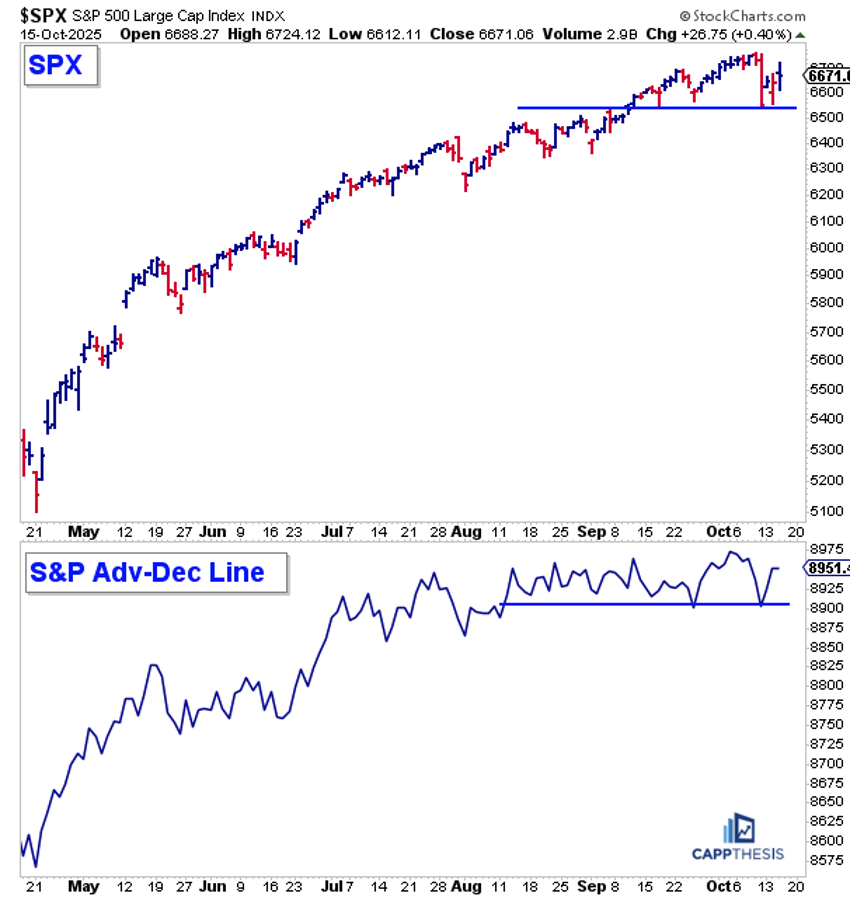
On October 9 and 10, the S&P 500 logged two consecutive weak breadth sessions, with only 24% and 15% of stocks advancing, respectively. That was the first back-to-back instance of 25% or fewer advancers since April 3–4, when the readings were much worse, at 16% and 3% respectively.
While the market environment is different now, the key takeaway is understanding how such episodes can eventually impact the Advance-Decline Line (A/D Line). So far, as the chart shows, it hasn’t. Those two weak sessions only pulled the cumulative A/D Line back to September levels, and it has since rebounded, bringing it close to its prior high.
The A/D Line’s behavior has closely mirrored the S&P 500 — brief setbacks followed by renewed strength. We’ve been watching closely for any change of character, and while there have been pockets of subpar internals, both breadth pullbacks and price dips have remained temporary.
At this point, the A/D Line continues to trend higher, in step with the uptrending S&P 500.
Trend Check: GoNoGo Trend Indicator Still Bullish
The GoNoGo trend remains bullish despite last Friday’s plummet. As we know, the S&P 500 has seen seven countertrend sell signals (red arrows) up to this point. None of these has resulted in a NOGO signal as of yet.
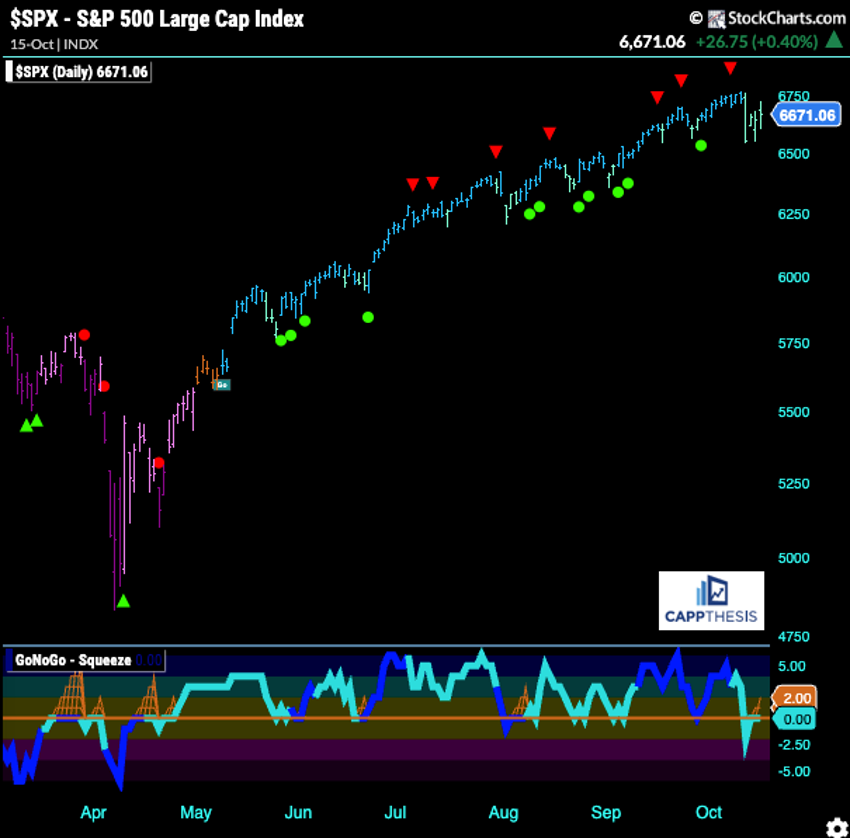
Chart Patterns to Watch
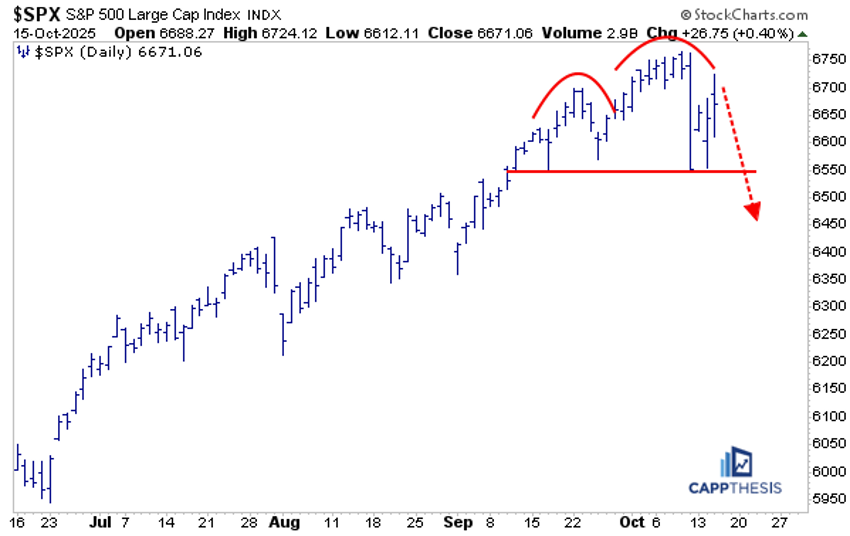
We’re still watching these two key pattern scenarios closely, and the implications are clear.
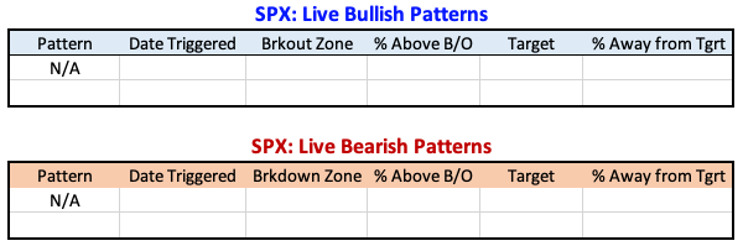
If the stock market rallies toward recent highs and then forms a higher low, we could see a powerful bullish formation develop, something that we’ve been waiting to see form for a few weeks. If that setup materializes, it could offer a strong opportunity to be taken advantage of either during or just after earnings season.
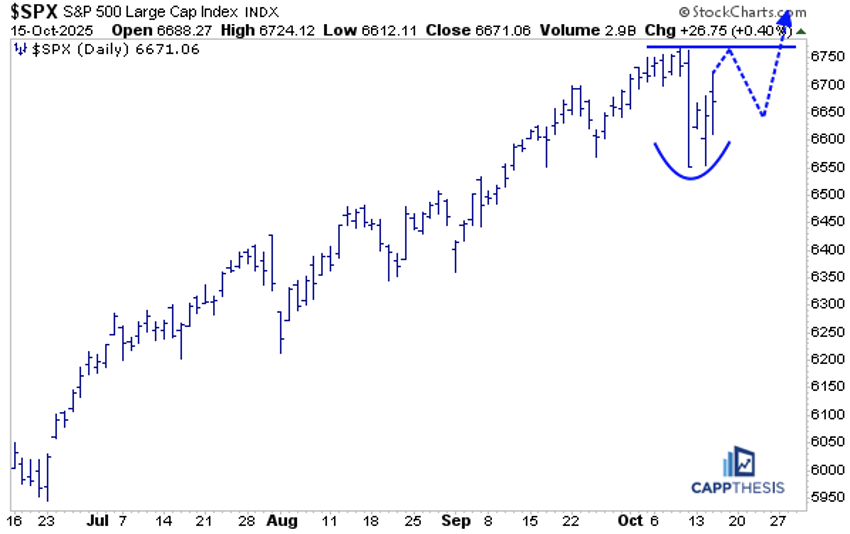
Any rally attempt that fails to clear the last all-time high would signal a potentially damaging lower high. When combined with the price action since September, that setup could complete a bearish formation, one with very little short-term support beneath the 6,550 area. If that level breaks, downside momentum could pick up quickly. That would reinforce the view that the market remains vulnerable to a deeper retracement.