Risk Assets Are Under Siege; Beware!

I started seeing warning signs of a potential market top in early December. Now, quite honestly, nothing has changed; if anything, the warning signs are growing. In my opinion, investors/traders should be exercising extreme caution.
Semis Hold Market Together
Semiconductors ($DJUSSC) have been the glue to hold the market together. A huge leader in this space has been Sandisk Corp. (SNDK), which has gained an astounding 1200% in just the past 5 months. SNDK just reported unbelievably bullish results and, at one point on Friday, traded up 137 bucks, or roughly 26%. That's the good news.
The bad news is that SNDK now appears to be in a "buy on the rumor, sell on the news" funk. SNDK is down nearly 100 bucks since that earlier intraday high and could be printing a reversing black candle on massive volume. Today could mark the top in the ringleader of the hottest group in the market. Check out this action.
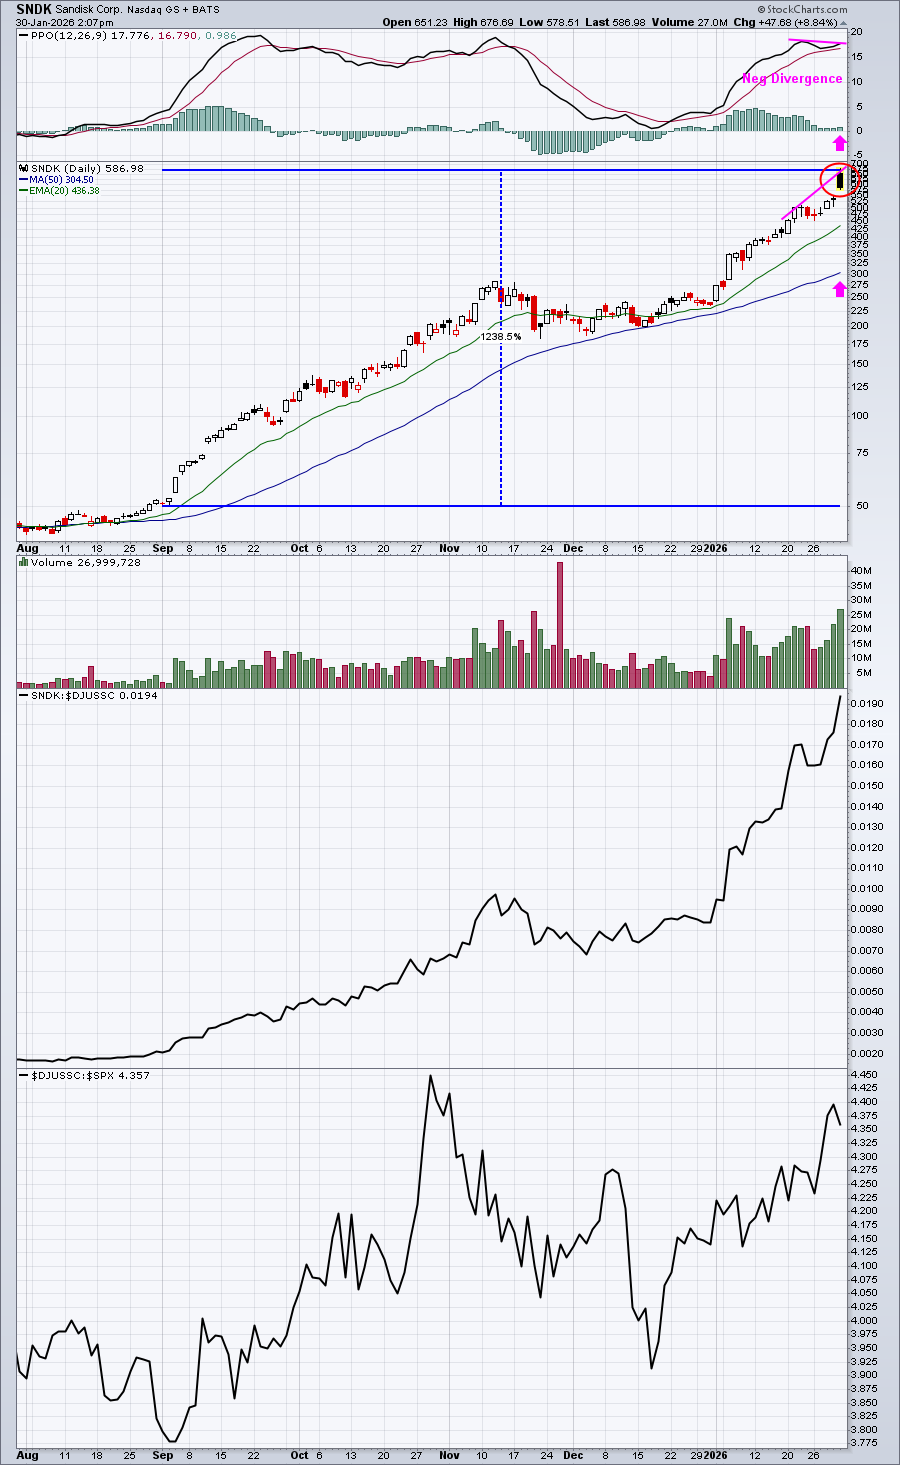
I'm always cautious when a negative divergence is present and a reversing candle prints. That's what SNDK faces as it potentially runs out of short-term buyers. I am not suggesting that SNDK is a bad stock but, short-term, it could be way overpriced. We're about to find out.
Semis sure look like a very crowded trade to me right now.
Cryptocurrencies Break Down
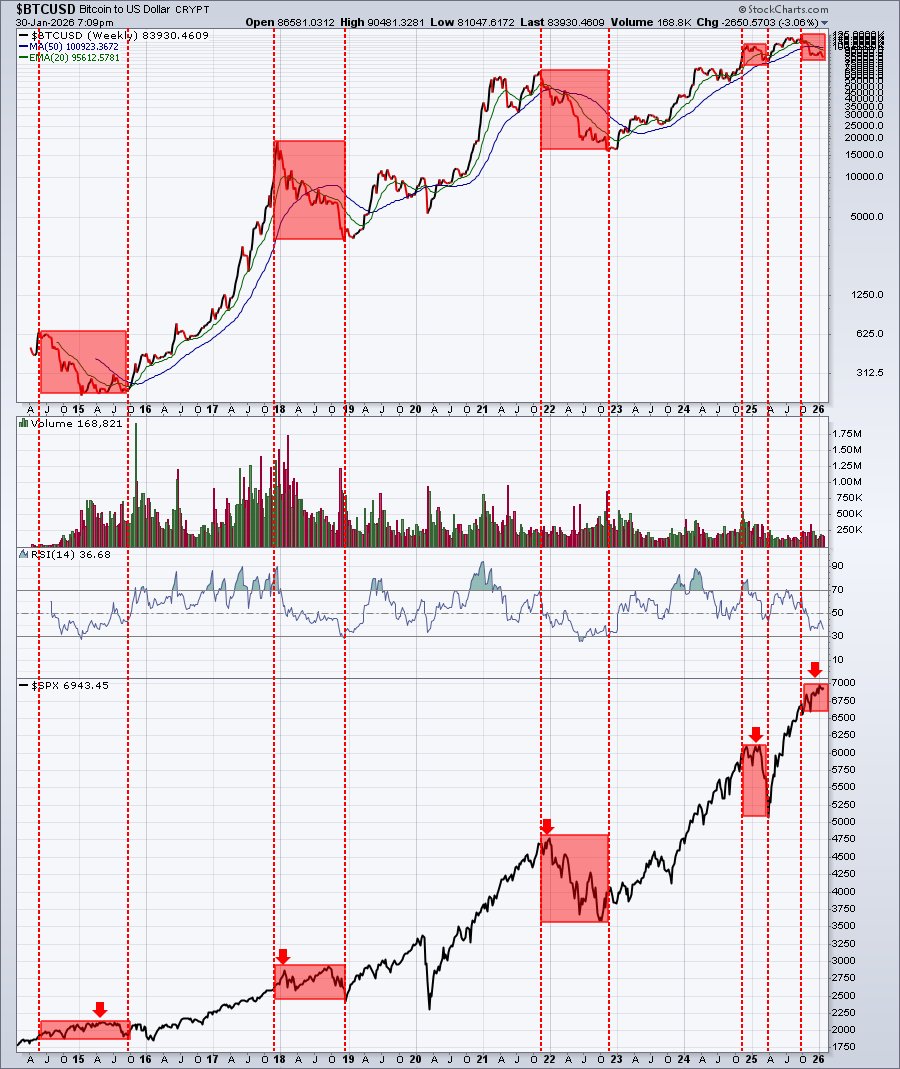
Next up is cryptocurrencies. We're seeing another breakdown in this asset class, which I consider to be a very high-risk asset class. Any time investors are shunning risk, I worry about stocks. I provided a chart recently of Bitcoin ($BTCUSD) and how weakness there in the past has preceded stock market weakness. Given the latest breakdown in Bitcoin, it's worth sharing this chart again.
A Rotation In Play?
And how about the bearish rotation away from growth (other than semiconductors) that we've seen for the past two to three months? It's similar to what we saw last year and in early 2022, just before both cyclical bear markets.
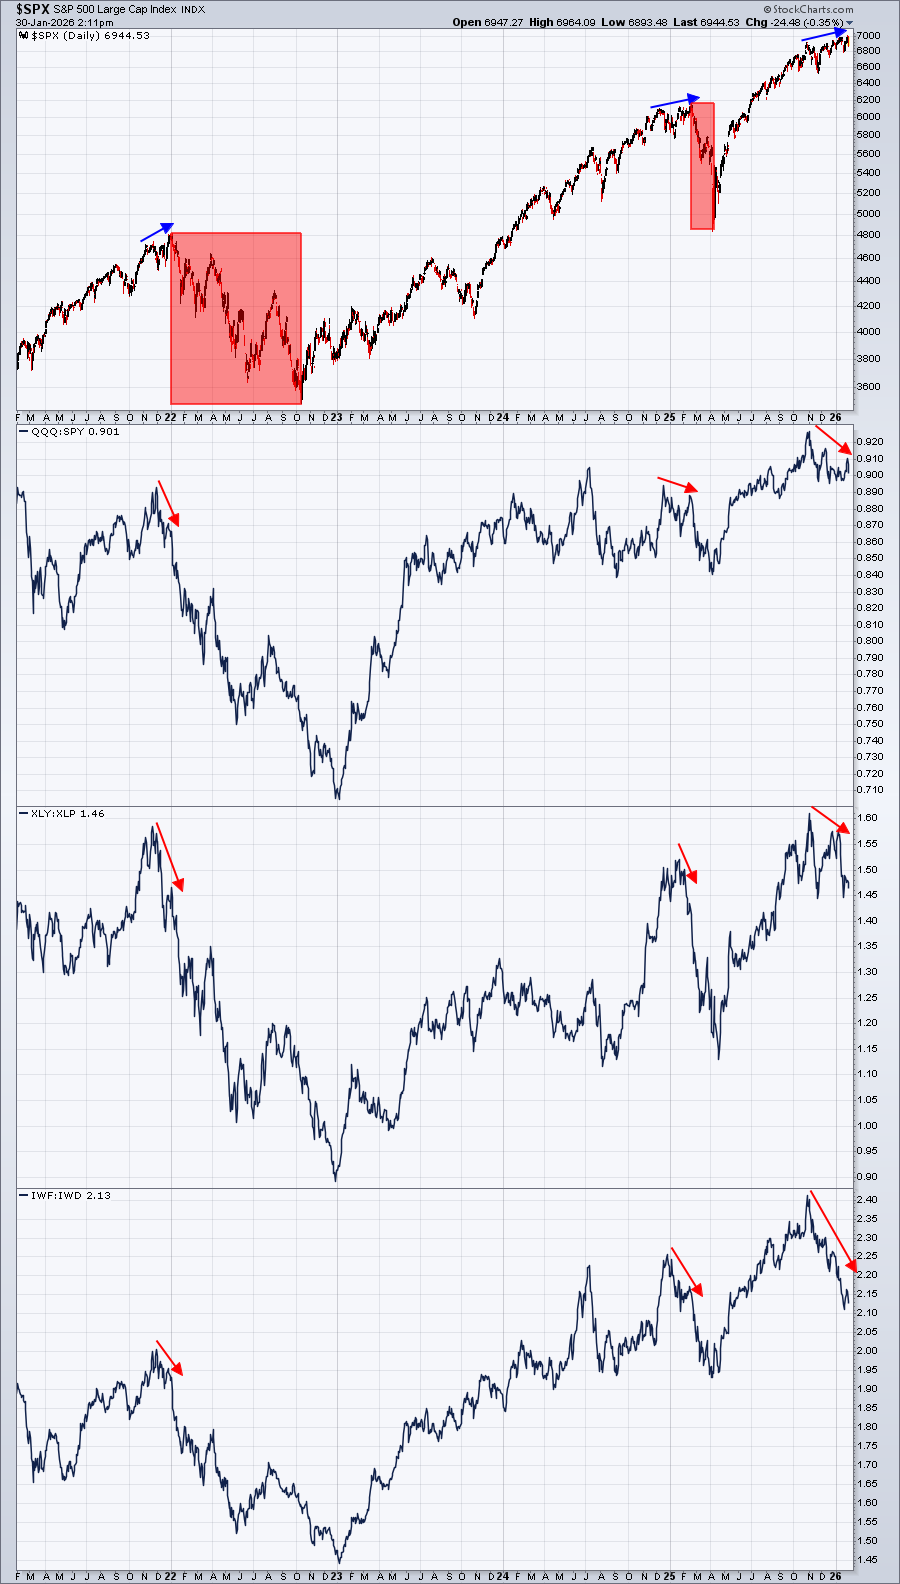
This rotation isn't new; it's happened before each of the last two bear markets. It's a story told by the charts, one in which Wall Street is scurrying for the exits in the high-profile risk names while parading on CNBC, telling us everything is great and that the stock market will go higher in 2026.
A Yahoo! Finance article recently indicated that all 21 analysts it polled suggested the stock market would go higher. Then why are they bailing from areas that typically lead secular bull market advances? Don't trust them.
All Eyes On Sentiment
Finally, equity options traders have gone all in. They've been buying equity call options like there's no tomorrow. When this trade gets one sided, we're typically ripe for at least short-term weakness. Check this out.
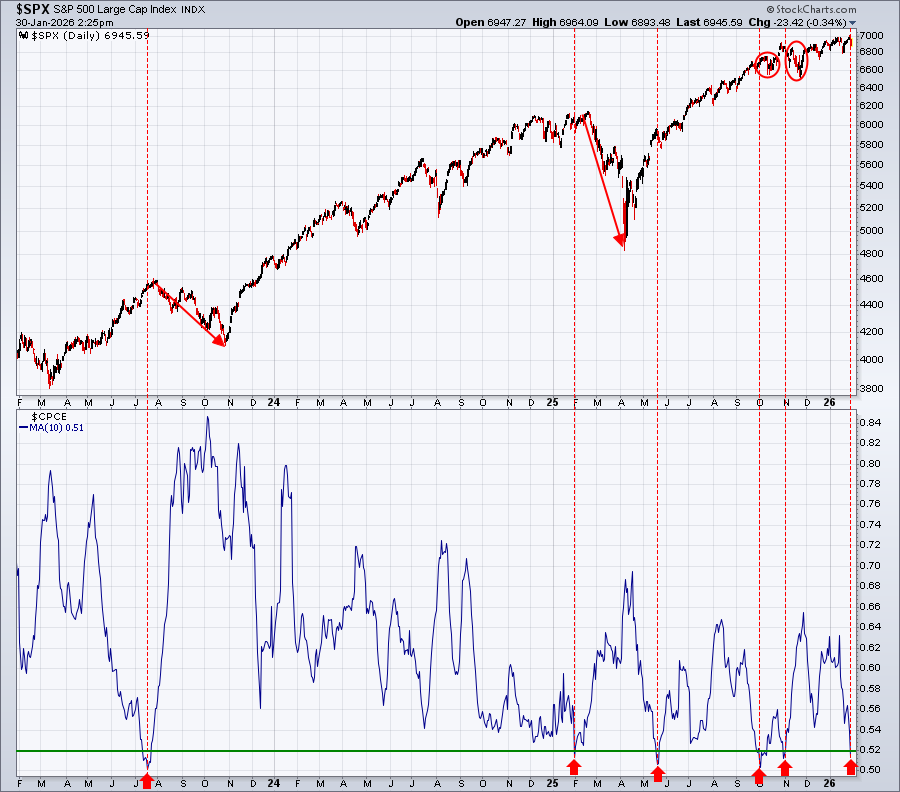
Usually, I use the 5-day SMA of the equity only put call ratio ($CPCE). However, to show fewer signals over the past 3 years, I used a 10-day SMA for the purpose of this illustration. Any time the 10-day SMA of the CPCE has moved down to or below 0.52, not-so-good market action has mostly taken place. Again, this suggests a very crowded trade in which equity options buyers believe the stock market can only go higher. We know how that usually ends — painfully for those options buyers.
Stock Market Fantasy Draft
In mid-November, Grayson Roze, Julius de Kempenaer, and I were joined by the StockCharts Technical Rank team ("SCTR Team) to draft 10 equal-weighted stocks. Once a stock was drafted, it was no longer available to the others. Therefore, we didn't have the ability to select whatever stock we wanted, because if it was already selected, it was GONE. There was strategy involved and it was a TON of fun, not to mention educational.
The results?
Well, StockCharts.com's very own exclusive tool, the SCTR, a relative strength indicator, beat us like a drum! (through results calculated as of a few days ago). The good news, though, is that we all matched or beat the S&P 500! When you have 4 "drafters" that cannot draft the same stock twice, it means that 40 different stocks were selected. As a group, we CRUSHED the S&P 500, rather impressive given the diversification in picking 40 different stocks. Also, for full disclosure, Julius beat Grayson and I rather easily, so now it's REVENGE and REDEMPTION time!
On Saturday, February 7, 2026, we're having our first-ever "Super Bowley Challenge". Yep, it's another stock fantasy draft and it's the same players, with one addition: David Keller has thrown his hat in the ring! Dave is going to join Grayson, Julius, and I, along with the SCTR Team, at 10:00am ET on February 7th to do another 10-round draft.
But there's one big difference this time around. It's not November. We won't be in the most bullish seasonal time of the year (Q4). And with all the warning signs in the stock market, what strategy will everyone take? That's a very good question. It'll be loads of fun and extremely educational. What investments do we seek? Chase gold and silver? Jump into improving energy and materials sectors? Bank on banks? Watch for a continuing explosion in semiconductors?
Your guess is as good as mine at this moment. But it's time to start prepping!
This is a FREE LiveStream event open to the public. For more information and to register, CLICK HERE! I hope to see you there, I personally cannot wait!
Happy trading!
Tom


