Risk-On Ignites: What the U.S.-Iran Truce Means for Markets

Key Takeaways
- A ceasefire in the Middle East triggered a sharp global rally, lifting beaten-down country ETFs and cyclical sectors at home.
- Oil plunged, yields fell, and the VIX slumped to near 20, signaling a potential regime shift.
- Early technical strength emerges, but follow-through will determine if the rally holds.
“I want you all to forget the flight plan. From this moment on, we are improvising a new mission.”
That’s what Flight Director Gene Kranz told his Houston team shortly after an explosion rocked the Apollo 13 spacecraft. An unexpected calamity prompted the expert to improvise a new mission, one that didn’t include landing on the moon, given seemingly crippling constraints.
A Familiar Setup, Rewritten Script
Fifty-six years removed, Americans are once again orbiting the moon, all while macroeconomic shocks hit markets one after another. Normally, we’d be prepping for the Q1 earnings season, girding for inflation data, and parsing Fed speak. Not today.
The script is being rewritten, with global stocks climbing sharply following news of a two-week ceasefire between the U.S. and Iran. Both sides claim victory, but the real winners may be the “buy the dip” crowd.
Stock Market Reacts: Risk-On Reigns
The S&P 500 soared nearly 3% in premarket trade on Wednesday, April 8. It had all the hallmarks of the post-Liberation Day liftoff that occurred 364 days prior. Leading the move were, naturally, some of the hardest-hit areas: Asia-Pacific countries (EWY, EWT, EWJ, INDA), Europe (VGK), U.S. small caps (IWM), and industries like homebuilders (XHB) and Airlines (JETS), along with crypto and gold.
As the world of stocks launched, oil sank 12%. Energy shares cratered. Yields fell, the dollar dropped, and volatility broke its uptrend. I planned to gauge a few bank stocks today, but let’s run through several of the most geopolitically sensitive charts to determine if this rally has legs.
Tools of the Trade
Firstly, I’d encourage traders to check out StockCharts’ ACP (Advanced Charting Platform), the web’s most advanced, interactive financial charting platform, designed to transform the way you see the markets. It’s invaluable when volatility catalysts emerge during and outside trading hours. I had it fired up at 6 p.m. ET on Tuesday night, when the S&P 500 ETF (SPY) crept higher, then took off as if on a countdown.
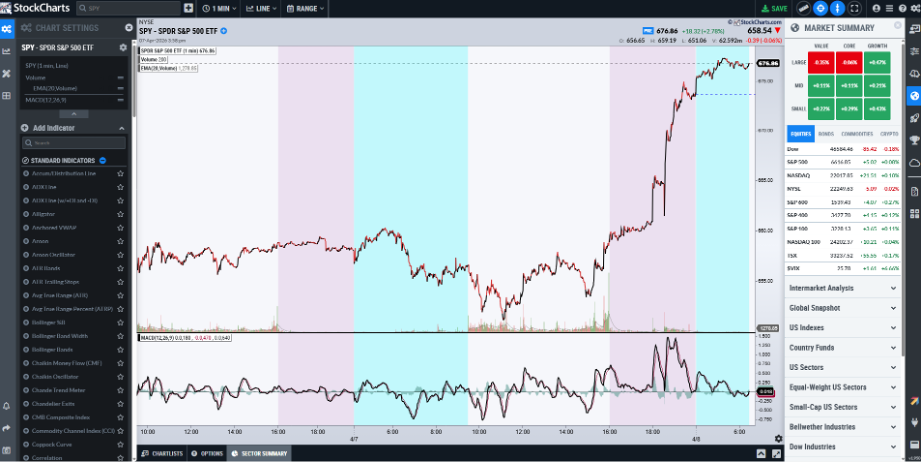
SharpCharts will serve us just fine for now, though.
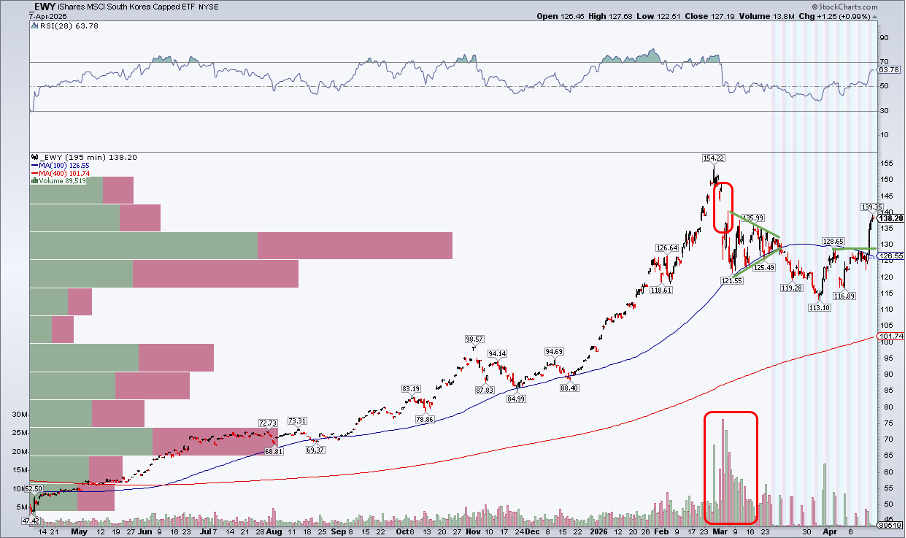
South Korea Leads the Charge
To begin with the highest-beta country ETF, the iShares MSCI South Korea ETF (EWY) nearly posted a 10% gain before the open on Wednesday. The rally from the $113 low to close out March hit 23% shortly after the ceasefire headlines.
Notice in the chart below that EWY is now solidly above its short-term 50-day moving average, a level at which it encountered selling pressure earlier this month. The all-time high is now 11% away, with former resistance at $129 now acting as support.
To view extended-hour price action, check that box below the chart. I'll take it a step further by doubling the moving average parameters (from 50 to 100 and 200 to 400), while applying a 195-minute period (two bars per day). This way, I can see the key moving averages in detail during premarket and after-hours sessions.
EWY bulls should eye a lingering gap at $147. That level is made all the more pivotal given the very high amount of volume-by-price that occurred when the ETF plunged. It had the features of a blow-off top, but South Korean stocks appear to be taking another run at $150.
Taiwan (EWT) and Japan (EWJ) have similar charts.
Global Equities and Homebuilders Diverge
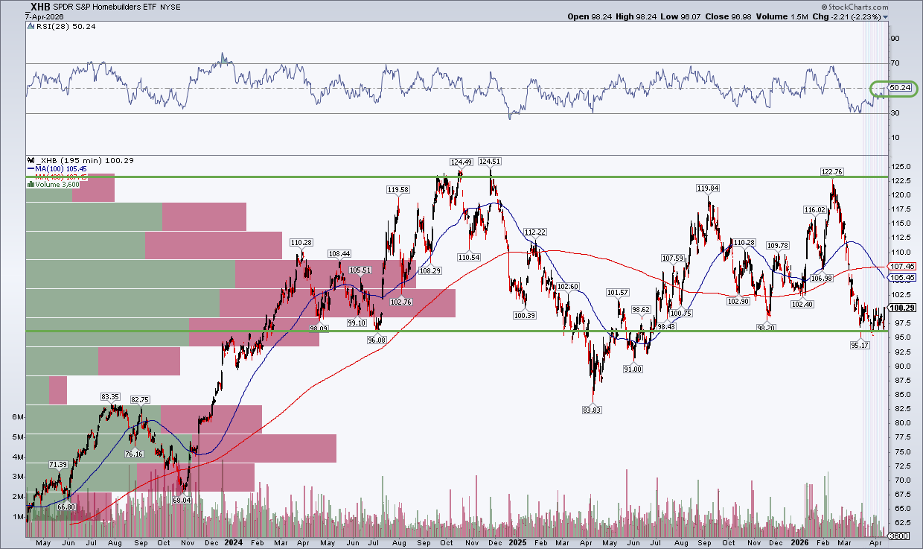
Let’s shift back home and look at homebuilders. The rate rise associated with Brent and WTI crude oil climbing toward $120 per barrel halted the homebuilders’ rally on a dime. While ETFs tracking countries highly dependent on Strait of Hormuz oil fell hard last month, domestic industrials reliant on lower Treasury yields also took a hit.
The SPDR S&P Homebuilders Fund (XHB) is less constructive compared to EWY and its Asia-Pac ETF peers. Even with a premarket bounce above $100, it remains below its 50-day and 200-day moving averages. About 20% under the late-2024 high and the peak from two months ago, this bellwether group does not yet signal optimism. But take a look at the RSI momentum oscillator at the top of the chart, which is just now climbing above 50. Technicians like to see this. Momentum is thought to lead price, so the RSI suggests a further price bounce.
Ultimately, XHB’s technical situation is a hot mess: long-term resistance in the $120 to $125 zone, while the mid-to-high $90s has attracted buyers. I’ll check back upon a breakout to new highs.
Is the Volatility Regime Changing?
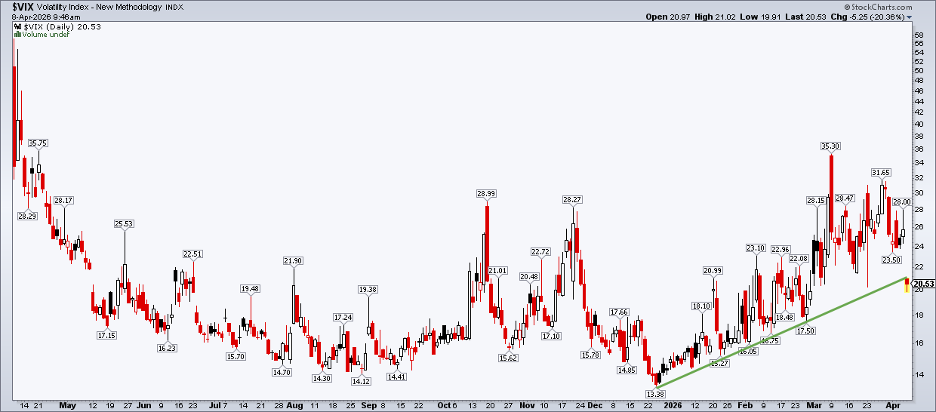
Let’s finish with a check on volatility. This macro chart may be telling us something. The Cboe Volatility Index ($VIX) had been stair-stepping higher since the end of last year. The 2026 ascent concerned macro-onlookers, as elevated (but not extreme) implied volatility levels often portend weak S&P 500 returns.
That has all changed now after the short-term reopening of the Strait of Hormuz. The VIX has broken its months-long uptrend, now printing a decisively lower low. While anything can happen in the days and weeks (or even hours) ahead, the market never reached the volatility crescendo many had called for. It peaked above 35, just nine days after the war in Iran began. High vol, soaring oil, and dismal investor sentiment made for a tough March.
I’d like to see a weekly VIX settle below 20 to help confirm a new short-term vol regime. April is historically a lower-volatility month and the one with the best global stock returns in data since 1988. Bears counter with a notoriously weak Q2 in midterm election years. My take? The VIX may take a breather, but don’t overlook it heading into the summer.
The Bottom Line
Stocks took off on Tuesday night following an apparent two-week truce between the U.S. and Iran. The geopolitical news overshadows key economic data ahead, including PCE inflation and March CPI later this week. Earnings season also feels distant, but JPMorgan Chase (JPM) kicks things off on Tuesday morning next week.
The S&P 500 is back above its 200-day moving average, the VIX is near 20, and many country ETFs that were beaten down in March show impressive initial gains. The days ahead will be critical to watch, as technical follow-through is required to stick the bullish landing.
Disclaimer: This blog is for educational purposes only and should not be construed as financial advice. The ideas and strategies should never be used without first assessing your own personal and financial situation, or without consulting a financial professional.