Sentiment Issues Short-Term Warning For U.S. Stocks

Not much has been able to stop U.S. equities as their run off the early-April low has been remarkable and unrelenting. At EarningsBeats.com, we've been more cautious of late, both because of historical concerns and, more importantly, bearish sentiment indicators. There's been no doubting the bullish technical action, but it was definitely time to pause this week and consider the possibility of at least short-term selling.
Historical September Weakness
Since 1950, the S&P 500 ($SPX) has fallen during September more often than it's gained. Right now, September 2025 would mark the 34th September since 1950 that the S&P 500 has closed higher. The index has closed lower 41 times in September. No other calendar month has lost ground more often than it's gained since 1950. The closest have been February, June, and August, which have all gained ground 41 times while losing ground 34 times.
If we dive into the inner workings of September, it's clearly the second half of the month that gives September its bad name. Here's how S&P 500 annualized performance breaks down during September over the past 75 years:
- September 1-16: +7.97%
- September 17-30: -25.63%
The September 20-26 week is the second-worst week of the year, having produced an annualized return of -43.09%. The selling that we saw this past week has literally followed this historical pattern to a tee.
Sentiment Turns Bearish
Sentiment is a contrarian indicator. In other words, too much bullishness can be short-term detrimental for the stock market. Options traders began pouring into calls vs. puts recently, and that can be seen by the 5-day SMA of the equity-only put call ratio ($CPCE), which nearly reached its lowest (most bullish) reading over the past year.
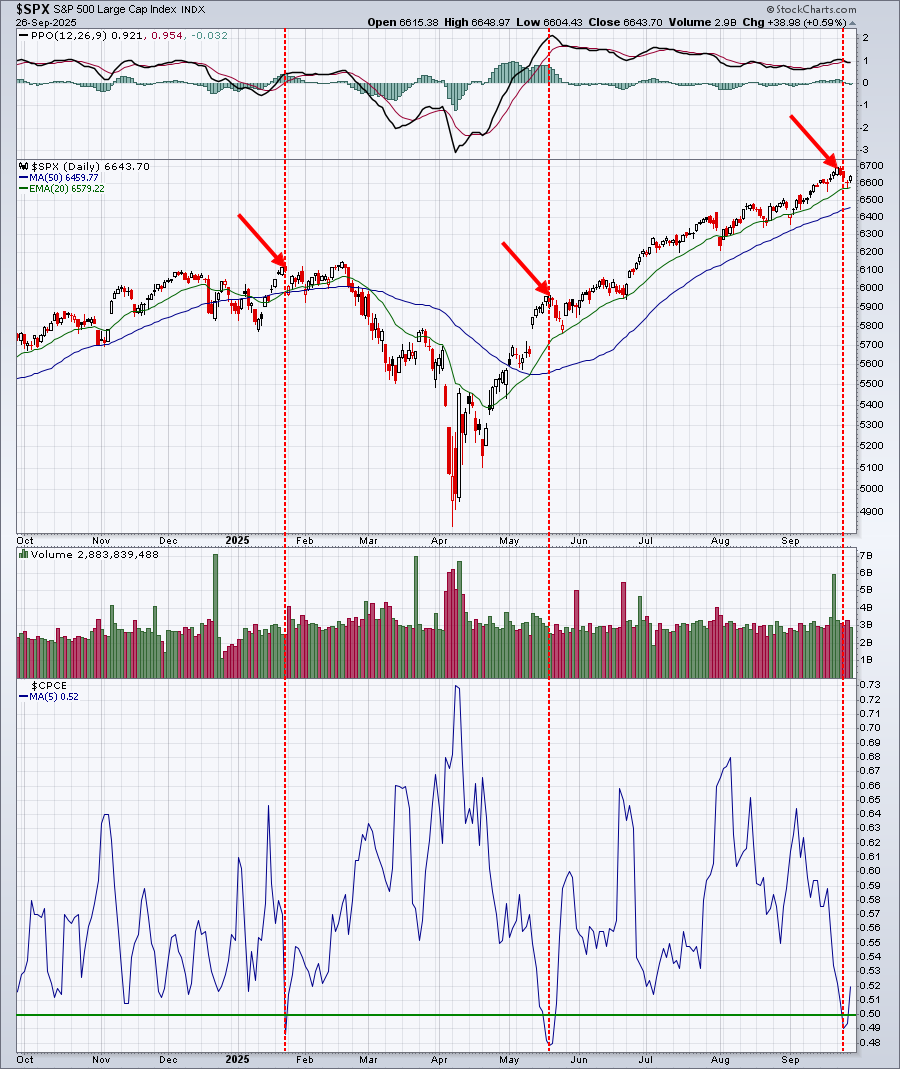
The last two times the 5-day SMA of the CPCE dipped below 0.50, the S&P 500 simultaneously topped, even if only for the short-term. This week, it appears to be confirming a short-term top as well.
The CPCE is a sentiment indicator that triggers from overzealous retail options traders. There's another sentiment indicator that is market-maker related, which is the Volatility Index ($VIX).
The VIX is calculated by combining the weighted prices of S&P 500 index options with expirations between 23 and 37 days, focusing on near- and out-of-the-money options. Typically, the VIX rises when the S&P 500 falls, and vice versa. During infrequent periods when the VIX and the S&P 500 move in unison for a period of time and the correlation coefficient turns positive, significant reversals have occurred on that benchmark index.
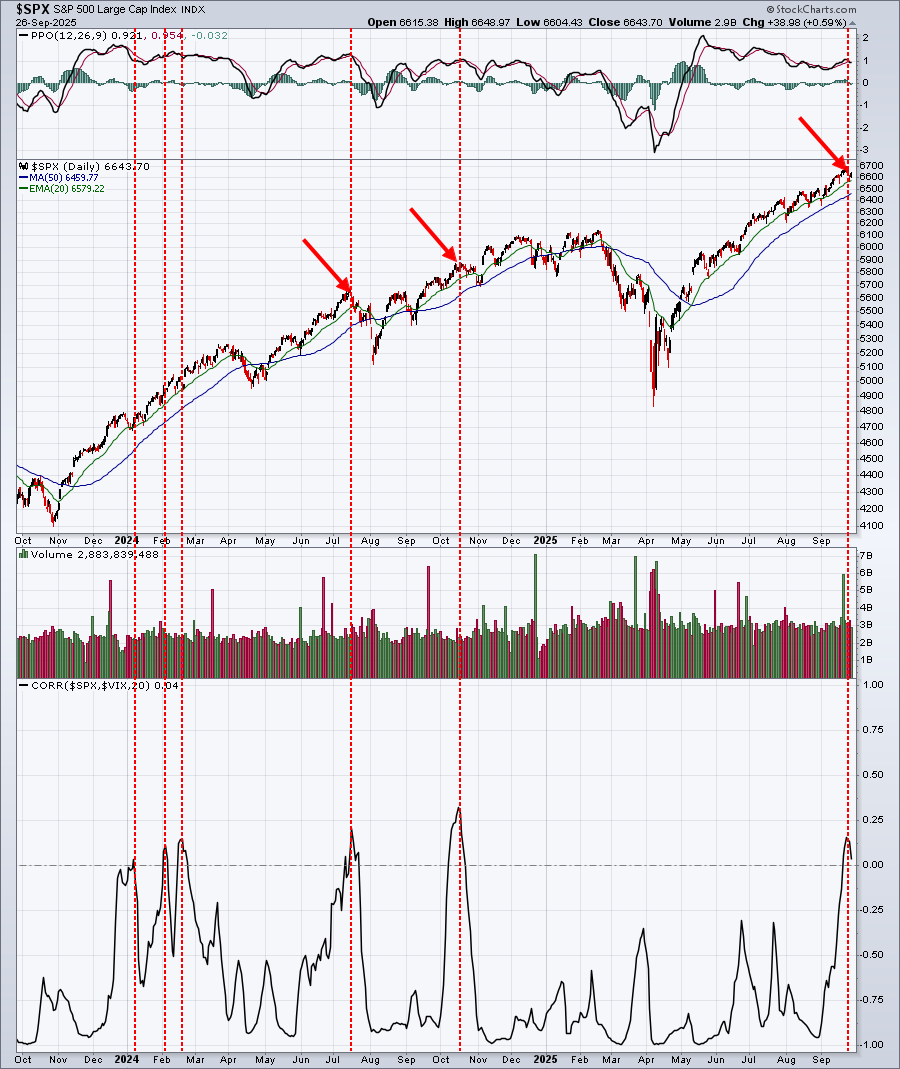
We have no guarantee as to what will happen from here, but there's definitely precedent from a sentiment perspective in these signals marking key tops.
Avoid Being Manipulated
It's been a difficult year thus far, with all-time highs early in 2025 and more recently in September, sandwiching a cyclical bear market from February through April. But my ultimate belief of a strong 2025 and a potential rise to 7,000 on the S&P 500 still looks to be promising and a good call.
Personally, I don't trust the big Wall Street firms as they tell us nothing about possible cyclical bear markets and secular bull market runs until after they occur. That's the topic of our huge Saturday event, "2 Ways Wall Street is Failing You", at 10:00 am ET. This is a FREE event, and you can get more information and REGISTER HERE. I'll see you there!
Happy trading!
Tom


