September’s Final Stretch: Why Stocks Face Their Trickiest Days Ahead

Key Takeaways
- The S&P 500 entered Fed Day strong, but late-September seasonality points to weakness.
- Materials (XLB) shows technical cracks, making it a potential short candidate.
- Low implied volatility makes put options a cost-effective tactical play.
Stocks came into Fed Day on the front foot. The S&P 500 ($SPX) tallied a string of record closes last week, bucking the usual trend of September weakness. Push may come to shove in the coming sessions, though.
Seasonality Worst Toward End of September
Zooming in on calendar trends, the final 10 days of the third quarter are historically more treacherous, declining 1.1% on average in all instances dating back to 1928. That nugget comes from Paul Ciana at BofA. The technician also notes that Year 1 of the Presidential Cycle has produced even worse SPX returns.
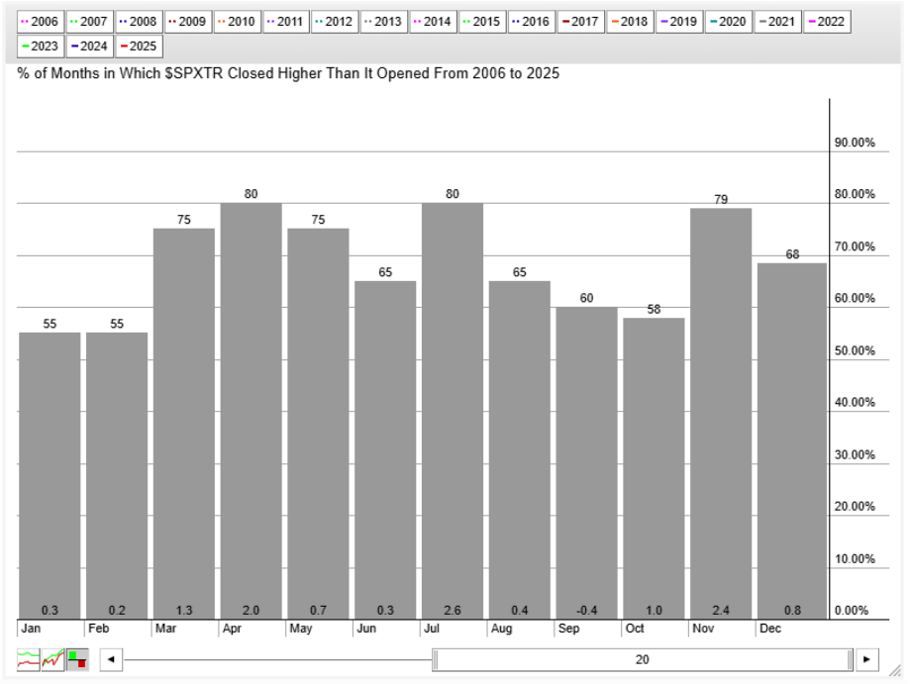
Focusing on modern times, StockCharts’ Seasonality tool highlights the turn-of-the-quarter soft patch. Since 2006, the S&P 500 Total Return Index (SPXTR) has posted a 0.4% average drop, with a positivity rate of 60%. October fares somewhat better: a 1% climb, but with a low 58% positivity rate.
And then there’s the old Wall Street folklore: “sell Rosh Hashanah, buy Yom Kippur.” This year, that period begins on the evening of Monday, September 22, and ends on Thursday, October 2. The average and median S&P 500 decline over that stretch is about -0.5%.
Defensive Sectors Under Scrutiny
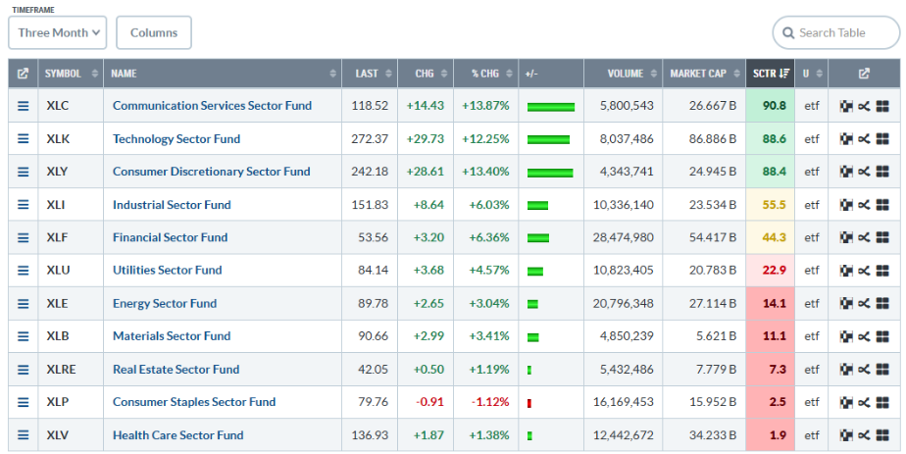
If we are to take a bearish bias into Q4, what might be the best sectors to target? For that, it often makes sense to press on what has been weakest. According to StockCharts’ Sector Drill-Down page, three areas stand out in red: Real Estate (XLRE), Consumer Staples (XLP), and Health Care (XLV). That trio of sector funds has the lowest SCTR (StockCharts Technical Rank) scores.
Macro investors and intermarket aficionados may be raising their eyebrows—shorting defensive sectors in anticipation of a market dip doesn’t make much sense. Rather, identifying high-beta but technically weak sectors and industries is perhaps the better blueprint.
Materials in the Crosshairs
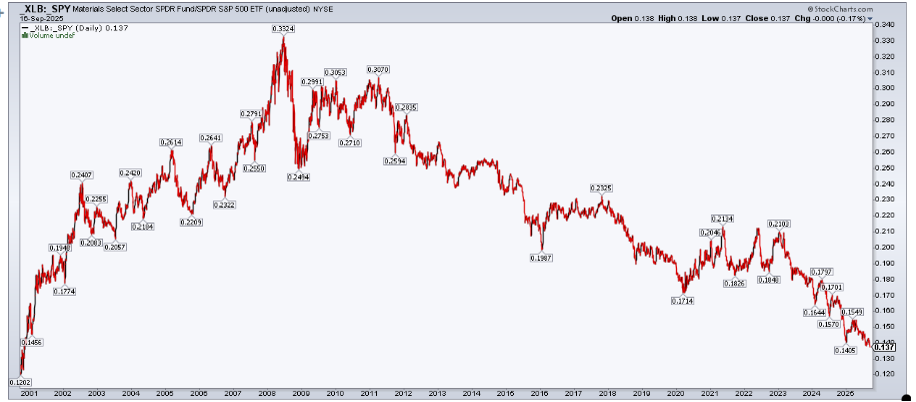
With that in mind, Materials (XLB) stands out. The resource-rich and economically-sensitive sector has failed to rally above its year-to-date highs in the $92-$93 range. Despite the monster rally in precious metals, XLB printed fresh century-lows relative to the S&P 500 ETF (SPY) at Tuesday’s close. Naturally, its SCTR score is soft at just 11.1, but, unlike Staples and Health Care, Materials often bears the brunt of risk-off selloffs.
Inspecting XLB’s technicals, what stands out is the noted resistance in the low-to-mid $90s. Notice in the chart below that the ETF also straddles its flattening short-term 50-day moving average. What’s more, the RSI momentum oscillator (top panel) has been printing a series of lower highs. It’s not a true bearish RSI divergence (since price action is sideways, not rising), but it does suggest that the bears have some control over momentum.
Longer-term, the 200-DMA trends lower—another bearish cue. Also, take a look at the volume-by-price profile on the left side of the chart. XLB is right in the middle of a high-congestion zone; a break below it would be technically significant from a long-term perspective.
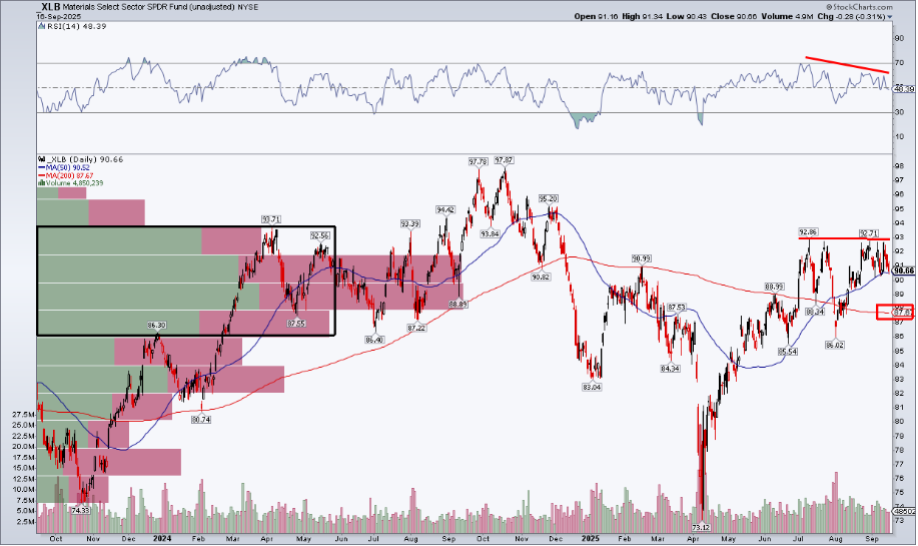
If we’re eyeing near-term corrective moves, then XLB may be an ideal top-down candidate. A pullback to the 200-DMA between $87 and $88 is certainly possible now through early October (as the bearish seasonal stars align). To be clear, this is a tactical idea, not a broad call on an imminent correction. Given the timeframe, options may be the ideal vehicle to execute the play.
Gold & Miners in Focus
StockCharts’ OptionsPlay Strategy Center helps traders identify promising options trade ideas based on customized parameters. Interestingly, when scanning for Bearish Counter Trend Long Puts over the next 21 days, Materials stocks and ETFs appear. On the list are Barrick Mining (B), SPDR Gold Shares (GLD), iShares Gold Trust (IAU), and VanEck Gold Miners ETF (GDX).
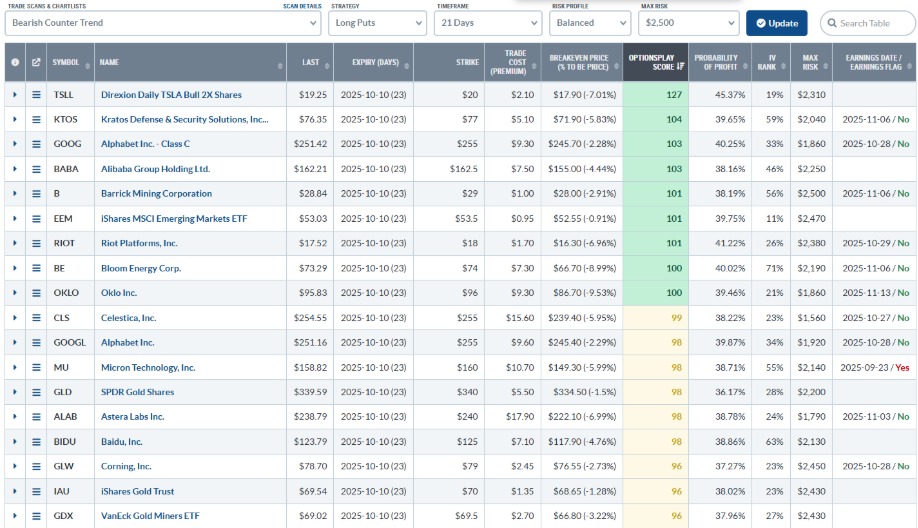
The elephant in the room is the Fed. Regardless of the rate decision, traders must focus on the market’s reaction and the “reaction to the reaction.” Now through early October, a bounce in the dollar and a momentum unwind could hit the Materials sector stocks the hardest. Making a long-put strategy more attractive is that XLB’s 30-day implied volatility is muted at under 17%. Conversely, if risk-on follows this week’s monetary-policy news and XLB rallies through $93, it would kill the trade idea outlined above.
The Bottom Line
‘Tis the season to eye spooky charts. The final 10 sessions of September are notoriously the worst of the year, with the old “sell Rosh Hashanah, buy Yom Kippur” trader wisdom pointing to a bearish bias. Materials, an underperforming but high-beta sector, may be particularly susceptible to near-term weakness. Low implied volatility and a tight timeframe make put options compelling.
Disclaimer: This blog is for educational purposes only and should not be construed as financial advice. The ideas and strategies should never be used without first assessing your own personal and financial situation, or without consulting a financial professional.


