Is the S&P 500 Stuck in Neutral? A Traffic Light Approach to Trend Changes

Any time I review a chart, my initial assessment involves determining the trend. Is this chart going up, down, or sideways? Or, to rephrase in terms of the supply and demand pressures at work, is this an accumulation phase, a distribution phase, or a consolidation phase?
There’s no denying that the trajectory of the S&P 500 has evolved quite a bit since the April 2025 market low.
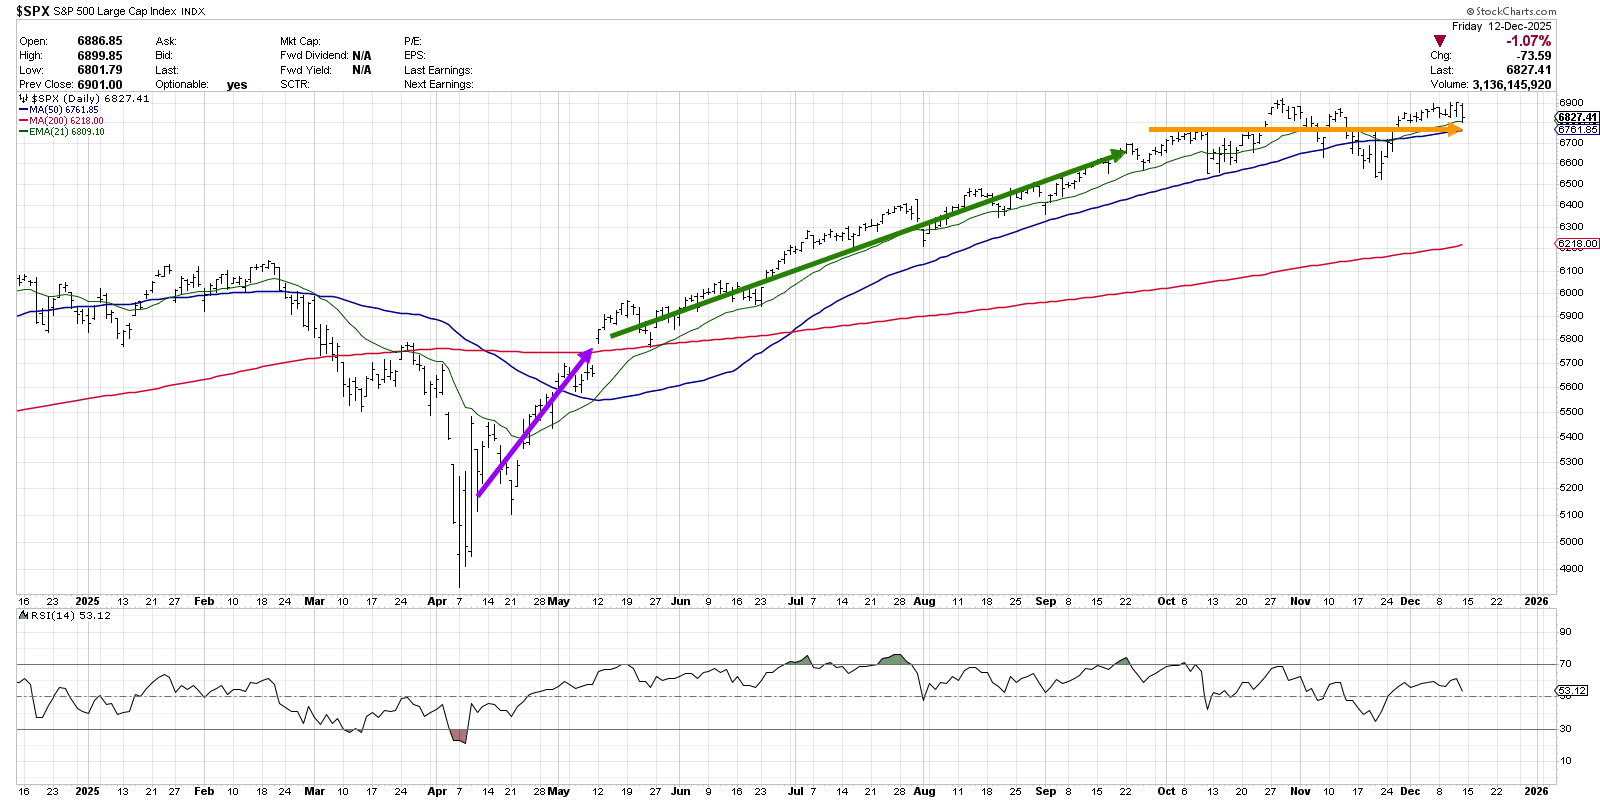
I would consider this chart to have three distinct periods starting in early April. First, we have an initial spike higher, which created the “V bottom” off the April low. Next, it settled into a low volatility uptrend where the trend continued at a steadier pace into the end of September.
Mindful investors know the value of pausing before turning the page on the year. In our upcoming FREE webcast, Winners, Losers & Lessons: Your Year-End Investment Review, I’ll walk through the key decisions, market themes, and takeaways that shaped this year’s investing landscape.
We’re going live on Wednesday, December 17th at 1:00 pm ET. You can learn more and register at https://marketmisbehavior.com/lessons.
But since the end of Q3, the S&P 500 chart has evolved into a clear consolidation phase, with fairly consistent resistance around 6900 and support at 6550. If the SPX were to break to a new all-time high above 6900, that would represent a new accumulation phase and give me confidence of further strength into the new year. A break below 6550, however, would confirm a new distribution phase and tell me to think more about capital preservation than capital growth.
So how can we visually acknowledge this sideways trend on the chart, using key support and resistance levels to indicate when this consolidation phase is over?
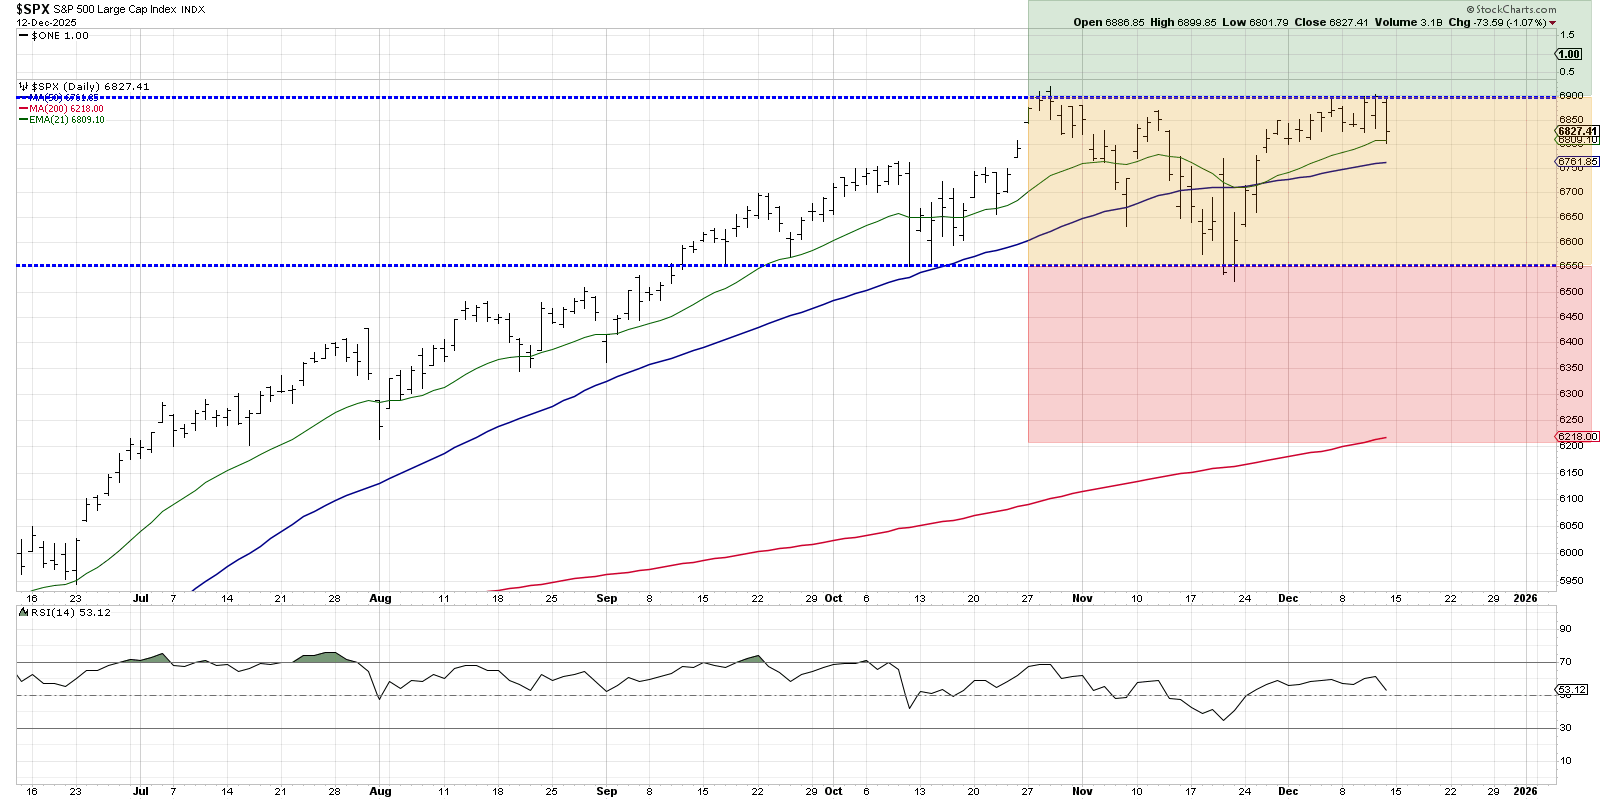
Using a “traffic light” technique, we can use the specific price levels to visually define the current sideways condition. I like to use thick horizontal lines to help me line up levels where the price has turned previously, as this could indicate where supply or demand pressures could shift.
While using the alert capabilities on StockCharts can be a helpful way to monitor performance relative to the thresholds illustrated in our traffic light, I usually save these charts in a ChartList that I will either review every morning, or at least every week when I prepare my Weekly Flight Plan for premium members.
When is it appropriate to apply this traffic light technique to a chart? In my experience, this is an approach that is designed to help confirm the end of a sideways trend. Thus, any time I can capture recent price action with a rectangle, suggesting fairly stable support and resistance levels, this technique can be of great value.
Here’s an example of Lululemon Athletica (LULU), which entered a consolidation phase after a gap lower in early September.
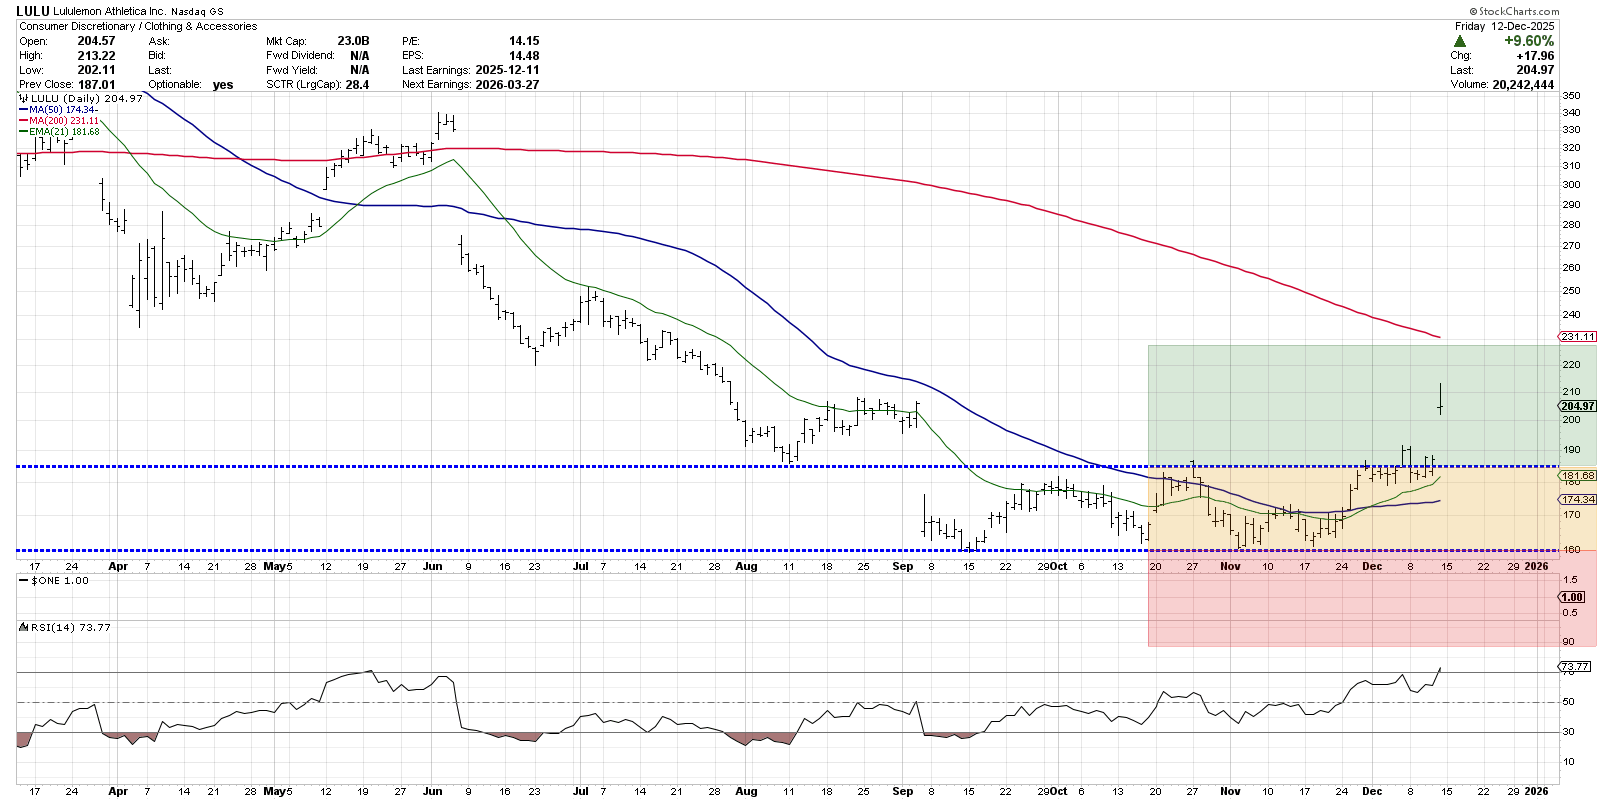
Once it was clear that LULU had established clear support at $160 and a consistent resistance point around $185, I applied the traffic light technique to develop a clear game plan for the next big move.
After a strong earnings report this week, Lululemon gapped higher to push well into the “green light” range on the chart. With this strong earnings-related price breakout, combined with improving momentum readings with the RSI well above 60, this appears to represent a clear rotation into a new accumulation phase.
One final note: While I’ve demonstrated the traffic light using the SharpCharts tools, StockCharts ACP users can use the built-in Traffic Light indicator to automate the creation and management of this powerful visual approach!
RR#6,
Dave
P.S. Ready to upgrade your investment process? Check out my free behavioral investing course!
David Keller, CMT
President and Chief Strategist
Sierra Alpha Research
marketmisbehavior.com
https://www.youtube.com/c/MarketMisbehavior
Disclaimer: This blog is for educational purposes only and should not be construed as financial advice. The ideas and strategies should never be used without first assessing your own personal and financial situation, or without consulting a financial professional.
The author does not have a position in mentioned securities at the time of publication. Any opinions expressed herein are solely those of the author and do not in any way represent the views or opinions of any other person or entity.


