The Stock Market’s Moving, But It’s Tapping the Brakes

Key Takeaways
- The S&P 500 is trending higher, but the real test is whether it can hold key downside levels.
- Price action suggests investors are hesitant to commit ahead of major near-term catalysts.
- Small-caps, transports, and other industry groups are showing improving participation, while mega-cap tech appears to be cooling.
It’s the first full trading week in the new year, and the market is already tapping the brakes.
The S&P 500 ($SPX) is still edging higher, but it’s doing so with caution, like a driver easing forward in traffic with one eye on the road and the other on the rearview mirror. With Friday’s December jobs report ahead and earnings season about to begin, investors aren’t flooring it; they’re waiting for a clearer green light.
A Slow Grind Higher
The hesitation shows up clearly on the chart of the S&P 500. Since mid-December, the S&P 500 has posted a steady sequence of higher highs and higher lows, continuing its slow climb above a rising 21-day Exponential Moving Average (EMA).
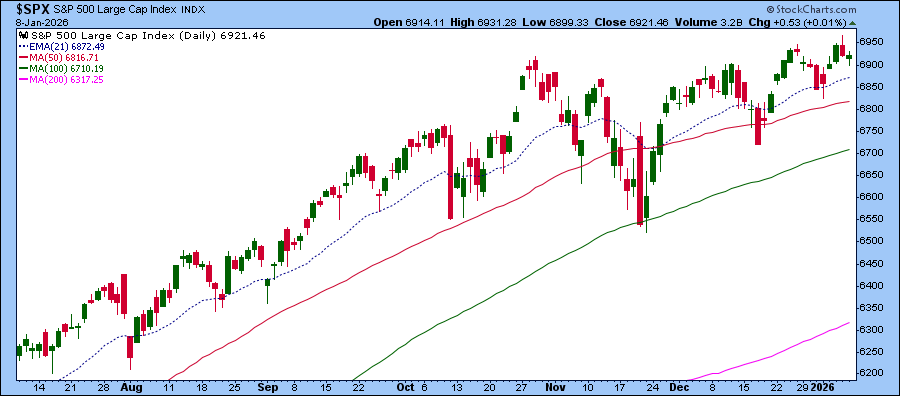
But despite all the upward movement, the index hasn’t shown much inclination to break out in either direction. Instead, the S&P 500 has just meandered higher slowly, almost as if it’s waiting for a catalyst to deliver the next decisive push.
This is why the key focus isn’t on how much higher the index can go, but how well it holds support if momentum fades. The first level to watch would be the 21-day EMA, followed by the 50-day SMA, which aligns with the January 2 low.
If these levels hold, the bullish trend will continue, but if they fail, the quiet climb could quickly lose its footing.
Market Participation Broadens
While the S&P 500 is in a holding pattern, other areas of the market are starting to play catch-up. This is an important development that investors shouldn’t ignore.
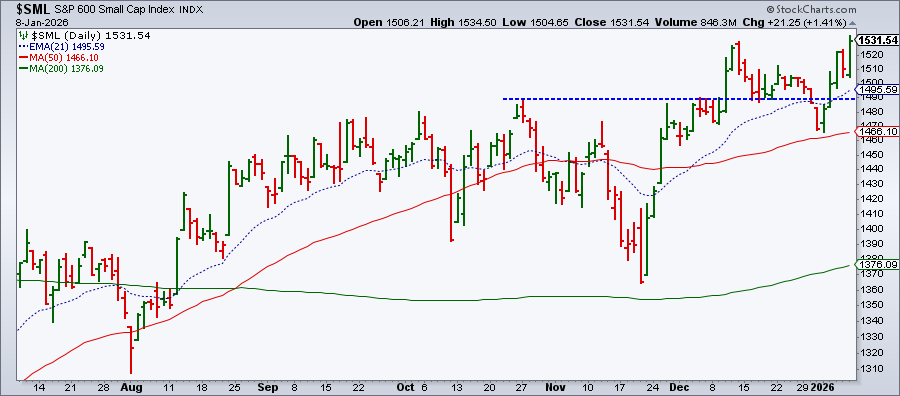
The Market Overview panel of the dashboard shows that the Dow Industrials ($INDU), NYSE Composite, Mid-Caps, and Small-Caps rose more than the S&P 500 on Thursday. The S&P 600 Small-Cap Index ($SML) led the pack, climbing 1.41%.
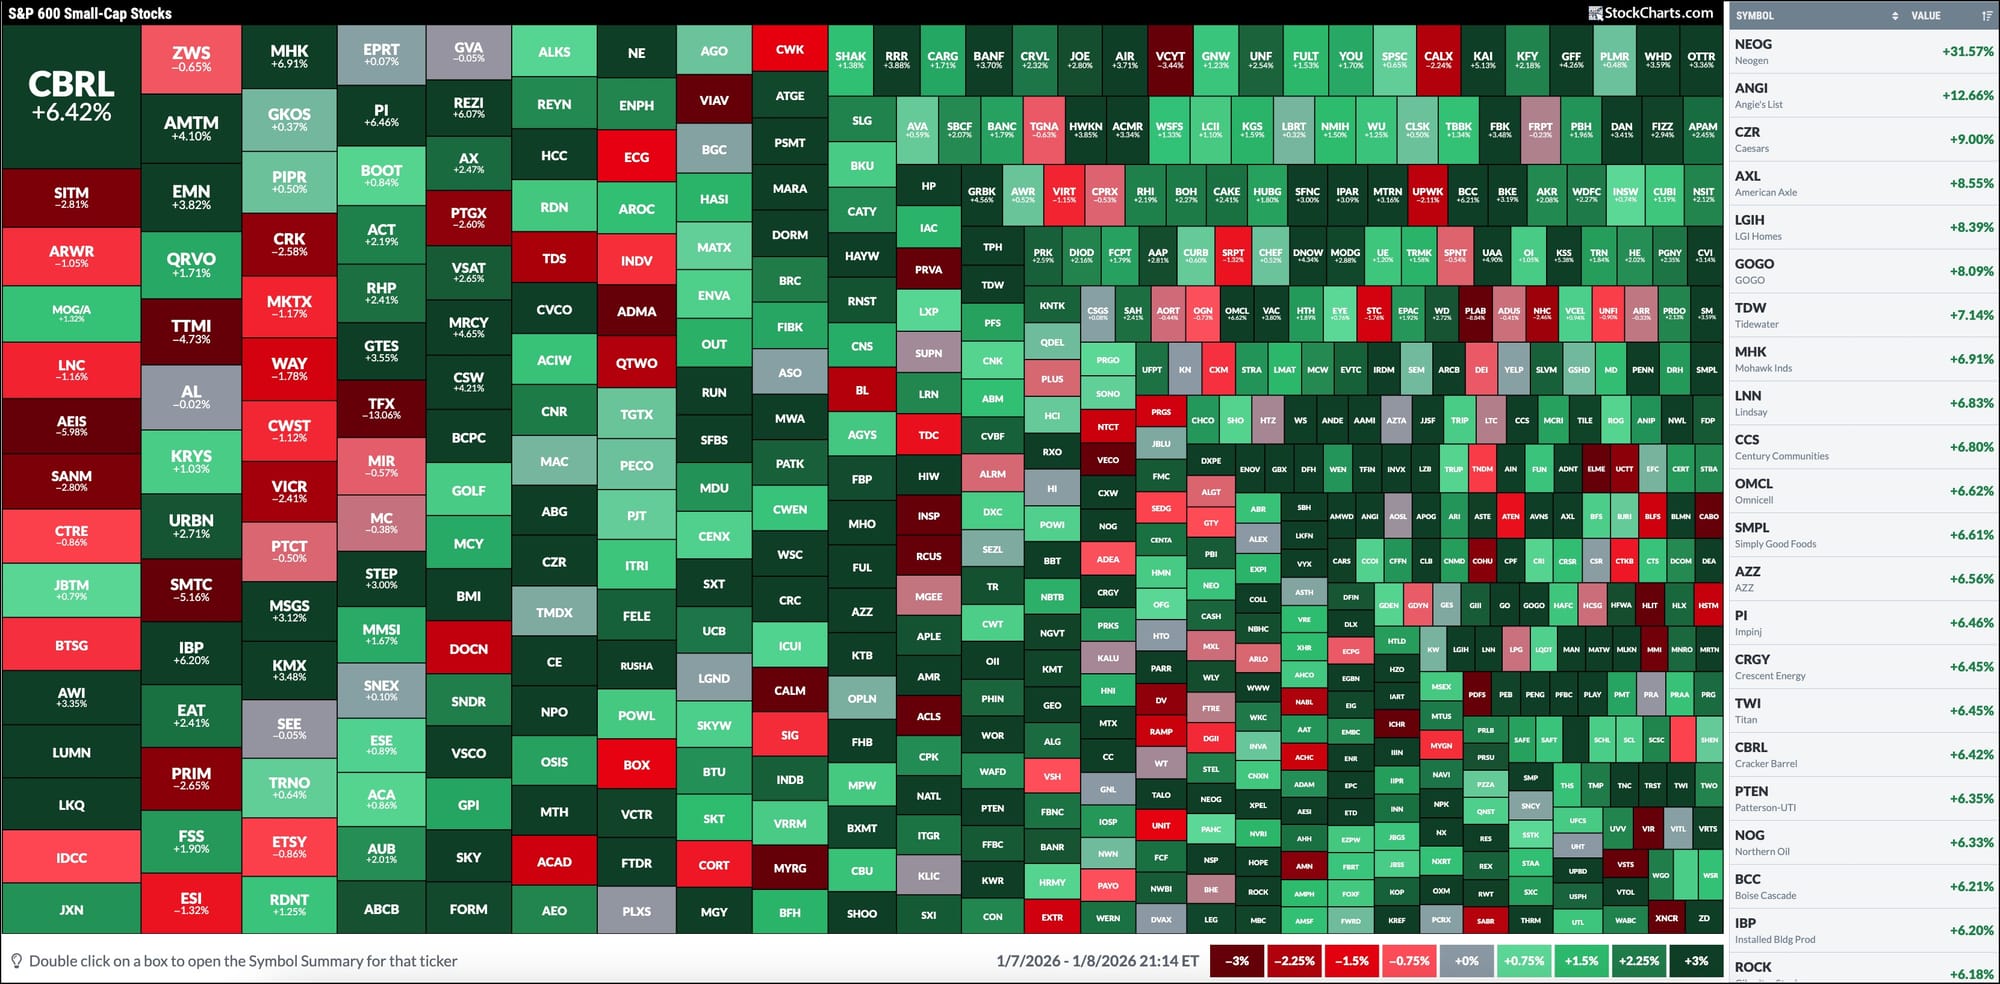
Small-caps tend to be more rate-sensitive and reflect confidence in the domestic economy. A look at the StockCharts MarketCarpet for the S&P 600 highlights strong moves in names that rarely make headlines. Thursday’s top performer was Neogen (NEOG), followed by Angie’s List (ANGI).
Small-Caps Start to Gain Ground
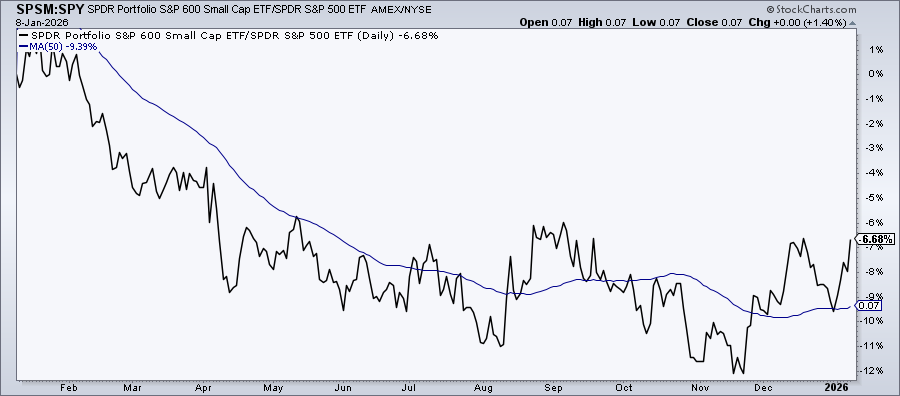
Small-cap performance is improving relative to large-caps. The performance chart below shows that, since November, the SPDR Portfolio S&P 600 Small Cap ETF (SPSM) has gained momentum relative to the S&P 500. Small-caps are still lagging large-caps, but the ratio is above the 50-day SMA, which is an encouraging sign.
Groups Showing Strength
Industry groups such as Homebuilders (XHB), Regional Banks (KRE), and Retail (XRT) stocks are starting to trend higher. Meanwhile, Dow Transports ($TRAN) is showing strong breadth, with a Bullish Percent Index of 90%.
Want to track these shifts quickly? The Market Summary page is one of the fastest ways to spot where strength is building. It’s worth checking regularly.
Big Tech Taking a Back Seat?
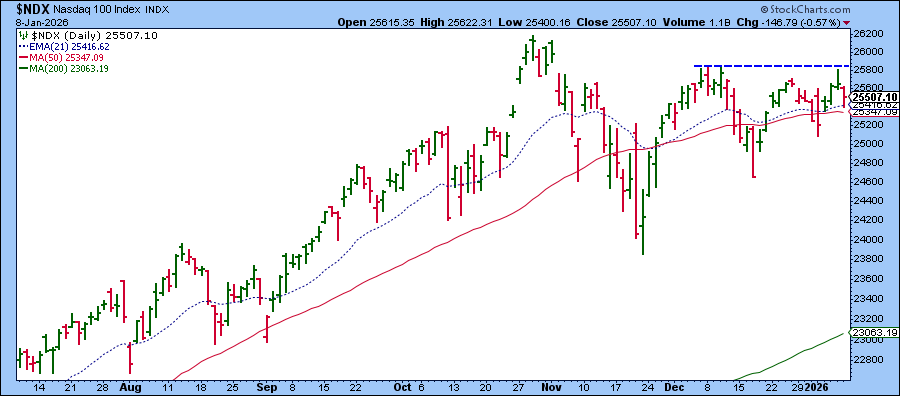
After driving much of the S&P 500’s strength in 2025, mega-cap tech may be taking a break to start the year.
The Nasdaq 100 Index ($NDX) is still maintaining its bullish position, although it’s not busting through the resistance (blue dashed line). Instead, it’s stalling beneath recent highs, while holding above the 21-day EMA, like the S&P 500.
The Technology sector is looking shaky. The chart of XLK below shows that its relative performance to the S&P 500 is declining, the 21-day EMA coincides with the 50-day SMA, which isn’t overly positive for the sector, and the Relative Strength Index (RSI) has slipped just below 50.
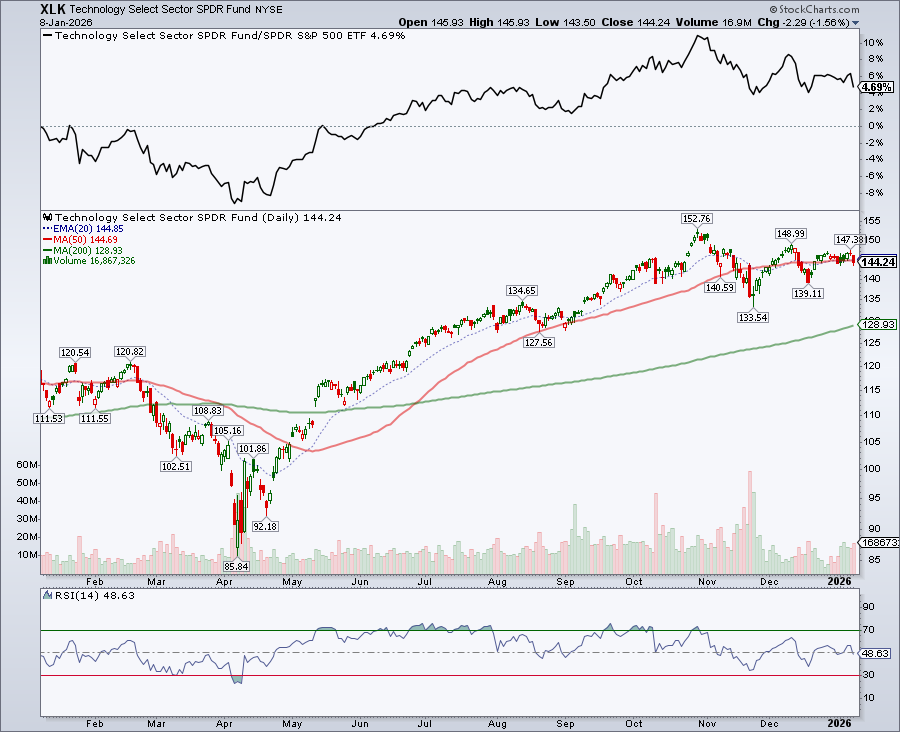
This doesn’t confirm a major breakdown, but it’s an indication that tech leadership is cooling.
Can the market rally without big tech’s participation? One way to monitor leadership beyond the heavy-weight large caps in the S&P 500 is to analyze the relative performance of the S&P 500 Equal Weighted Index ($SPXEW) to the cap-weighted S&P 500 (see chart below).
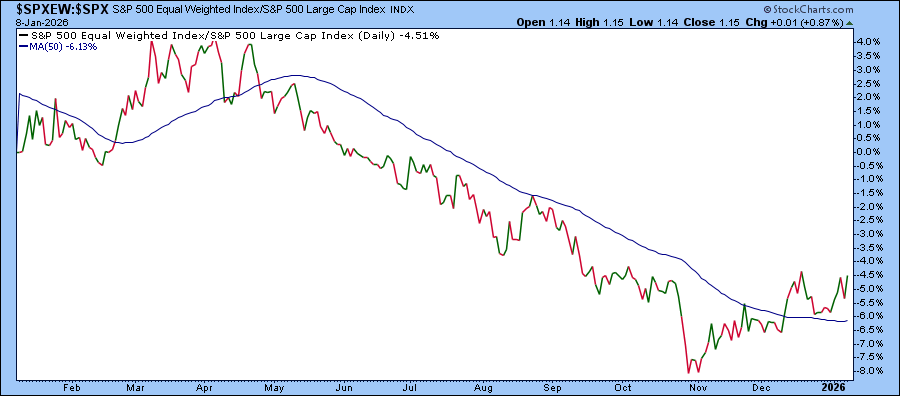
The 50-day SMA has been trending lower since May 2025, but may be flattening. Also, the ratio is now above the 50-day SMA, which is an early sign that the rest of the market may carry more importance.
If the performance of the equal-weight index continues to improve, maybe the next leg higher doesn’t have to depend on the Mag 7 names.
The Bottom Line
The S&P 500 is still trending higher, but this early-January move is more of a cautious crawl than a confident breakout. Your key focus right now should be to respect support levels, watch the catalysts, and track leadership.
If the 21-day EMA and 50-day SMA hold, the uptrend is still in play. But, if jobs data, headline news, or earnings deliver a surprise, the market could quickly pick up speed or hit the brakes. Keep an eye on participation. If it continues to broaden beyond mega-cap tech, then the 2026 market may look very different than 2025.
If you'd like to track these levels and leadership shifts in real time, save the charts from this article to your ChartLists so you can quickly revisit them as new data comes in.
Disclaimer: This blog is for educational purposes only and should not be construed as financial advice. The ideas and strategies should never be used without first assessing your own personal and financial situation, or without consulting a financial professional.


