102 Days Above 50-Day; New Lows Expand; Tech Power; Commodity Bull Market; Oil Gets Interesting

The SPDR S&P 500 ETF (SPY) reached a milestone this week as it held above its 50-day simple moving average (SMA) for more than 100 days, the seventh such occurrence since 2000. Even though SPY is 2.2% above its 50-day, only half of its components are above their 50-day SMAs, and new lows are expanding. However, a correction in SPY could remain elusive until tech stocks and the MAG7 buckle. Elsewhere, it's a bull market in commodities, and even energy is starting to turn up.
Key Takeaways
- SPY has been above its 50-day SMA for 102 days
- QQQ, MAGS, XLK, and XLC are powering the stock market
- Under the surface, stocks within the S&P 500 and Nasdaq 100 are correcting
- Commodities are in a bull market, with ETFs such as GCC and DBC trending higher
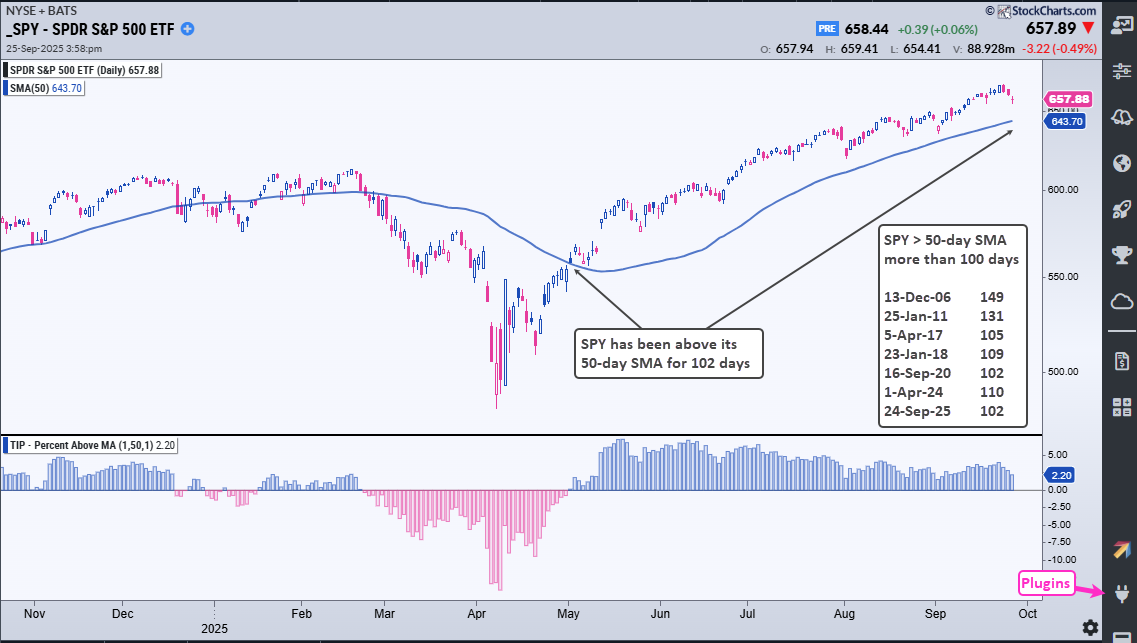
SPY Above 50-Day SMA for 102 Days
SPY crossed above its 50-day SMA on May 1 and has been above this moving average for 102 days. This is the seventh time since 2000 that SPY has held above its 50-day SMA for more than 100 days. The chart below shows the prior milestones with the date the number hit 100 and the total number of days above the 50-day SMA.
This shows just how shallow the pullbacks were since May, and that it has been a long time since a decent pullback. The bottom window shows Percent Above MA (1,50,1), which is the percentage difference between the close and the 50-day SMA. SPY is currently 2.20% above its 50-day SMA. This indicator is one of eleven in the TIP Indicator Edge Plugin for StockCharts ACP.
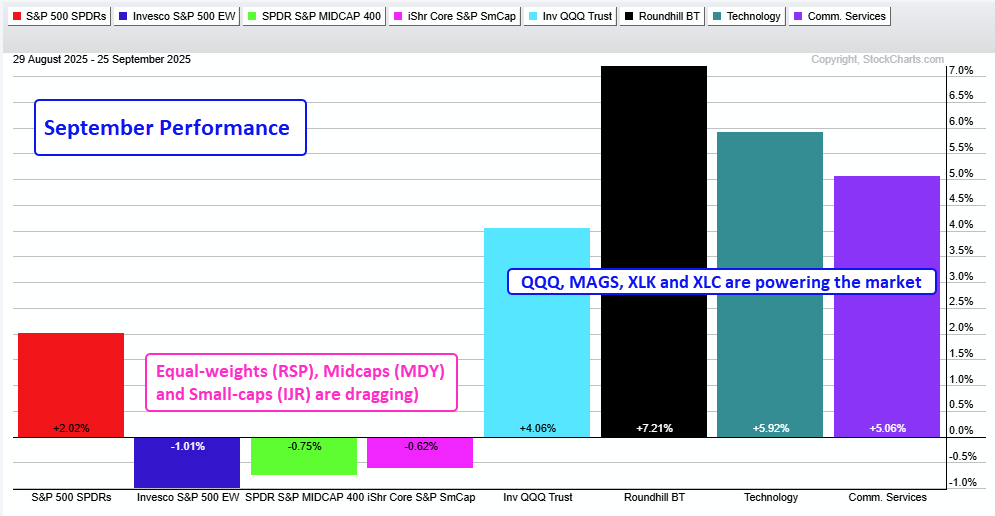
QQQ, MAGS, XLK, and XLC Power the Market
SPY and QQQ recorded new highs this week to affirm their uptrends. Thus far, SPY is up 2% in September and QQQ is up 4%. Life is good for large-caps, the MAG7, and the Technology sector. Tech stocks account for 34.5% of the S&P 500 and 61% of the Nasdaq 100. SPY and QQQ can continue as long as the MAG7 and tech sector remain strong. Elsewhere, note that the Invesco S&P 500 Equal Weight ETF (RSP) is down 1% so far this month. The SPDR S&P MidCap 400 (MDY) and iShares Core S&P Small-Cap ETF (IJR) are also down month to date. There is a bull market in one part of the market and a correction elsewhere.
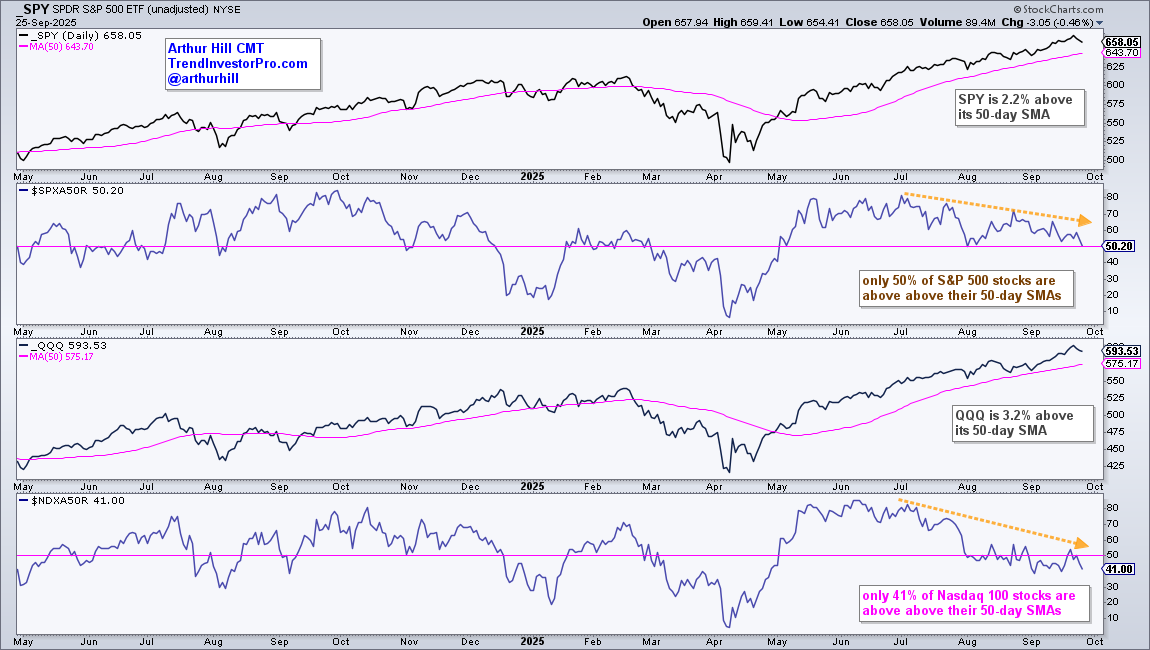
Corrections Within the S&P 500 and Nasdaq 100
Individual stocks are correcting when we look under the surface. SPY is 2.2% above its 50-day SMA and QQQ is 3.2% above its 50-day SMA. On the chart below, we can also see that only 50% of S&P 500 stocks are above their 50-day SMAs. This is the lowest number since early August. Weakness within the Nasdaq 100 is more pronounced, with only 41% of its components above their 50-day SMAs. These bearish divergences have yet to affect SPY and QQQ, but they "bear" watching.
Recent reports and videos at TrendInvestorPro:
- Utilities SPDR Follows Through on Breakout (plus 4 stocks)
- Uranium ETFs Extend Higher after Breakouts
- Oil Bounces off Bullish Setup Zone (plus 4 energy ETFs)
- Tech ETFs Lead as Speculation Increases
- Strategies for Trading and Accumulating
Click here to take a trial and gain full access.
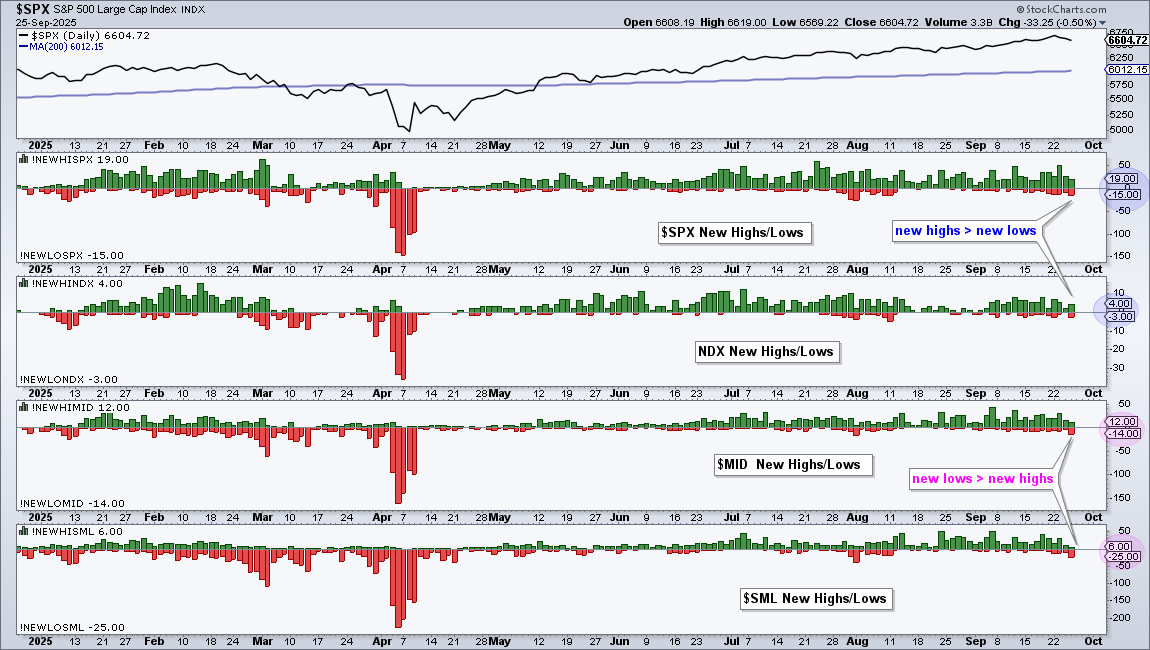
What a Drag It Is Being a Small-Cap
The stock market sneezed on Wednesday and Thursday, with the S&P 500 falling 0.78% in two days. Small-caps took it harder as the S&P Small Cap 600 fell 1.74%, more than twice as much as the S&P 500. Small-caps remain fragile as a group because the number of new lows (25) exceeded the number of new highs (6) on Thursday. Stocks hitting new lows are in strong downtrends, and the S&P Small Cap 600 has the most of the major indexes.
Bull Market for a Broad Commodity ETF
The WisdomTree Continuous Commodity ETF (GCC) is a broad-based commodity ETF with a sprinkling of crypto. Yes, crypto accounts for 6.38%. For reference, the chart below shows the component weightings in the upper left. GCC is in a strong uptrend with price well above the rising 200-day SMA and new highs here in September. There is a message here: commodities are in a bull market and should be part of our portfolio.
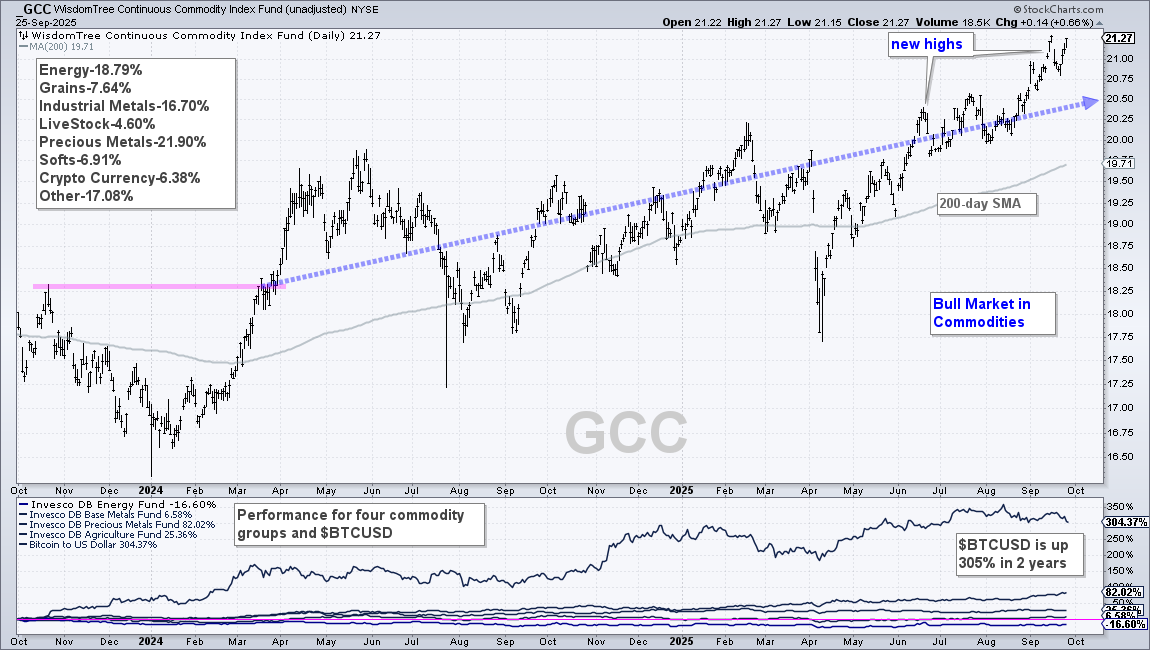
The lower window shows 2-year performance for Bitcoin and four commodity groups. Bitcoin is leaving the others in the dust, but the Invesco DB Precious Metals ETF (DBP) is up a highly respectable 82%. TrendInvestorPro is following the early September breakout in the United States Copper ETF (CPER).
Even DB Commodity ETF Shows Promise
The Invesco DB Commodity ETF (DBC) is a different beast because it is heavily weighted towards energy-related commodities (oil, gasoline, natural gas). As the weighting on the chart shows, energy accounts for a whopping 55.72% of the ETF. The bottom window shows Light Sweet Crude ($WTIC) and Brent Crude ($BRENT) in downtrends since April 2024 (pink lines).
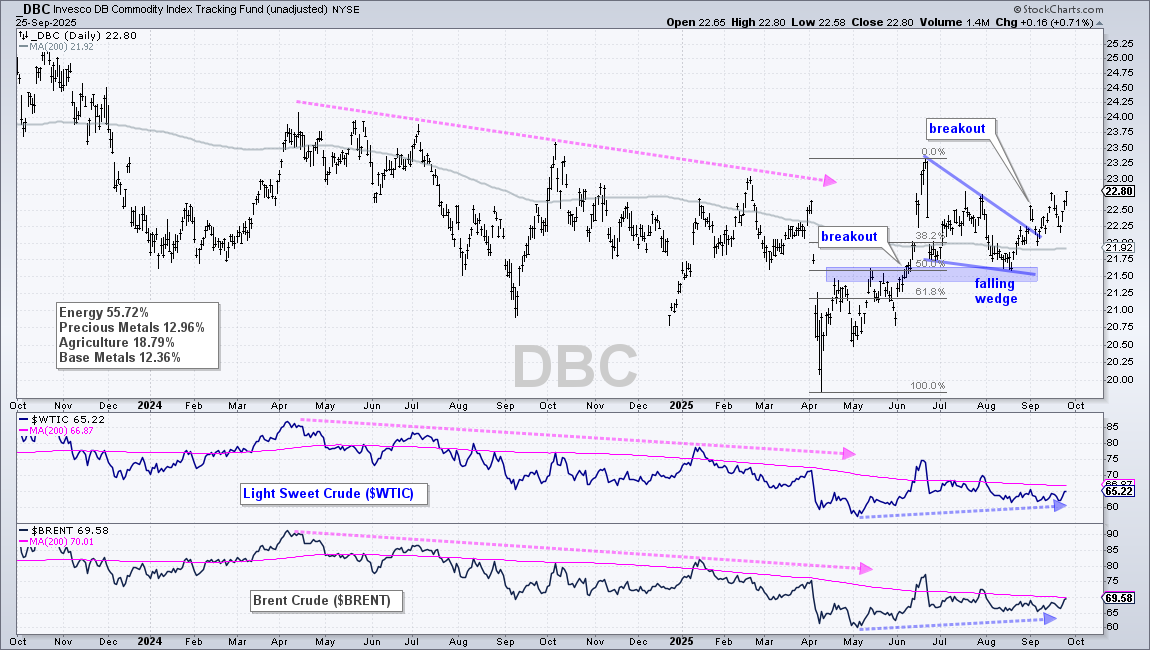
Despite downtrends in oil, I am seeing bullish price action on the DBC chart. Note that TrendInvestorPro covered oil and four energy-related ETFs in Thursday's report/video. DBC surged from early April to mid June with a breakout in the 21.50 area. It then fell back to the breakout zone with a falling wedge that retraced 50% of the prior surge. This is normal price action for a correction after a breakout surge (50% retracement, wedge, return to breakout zone). DBC surged in September and broke out of the falling wedge. This signals a continuation of the April–June surge and argues for higher prices.
See TrendInvestorPro for more chart analysis and videos.


