Stock Market Bounce or Breakdown? These Charts Hold the Clues

Key Takeaways
- Stocks are testing key support after Thursday's selloff.
- Monitor breadth and momentum for confirmation of the next move.
- Global markets are showing strength and are worth tracking.
Up until Wednesday, the stock market seemed content to drift sideways. Even a better-than-expected jobs report didn’t give stocks much of a push.
Thursday, however, was a different story. There was a noticeable selloff in equities, enough to make investors sit up and pay attention. One down day doesn’t make a bear market, but from a technical perspective, the stock market’s structure is starting to show a few subtle warning signs.
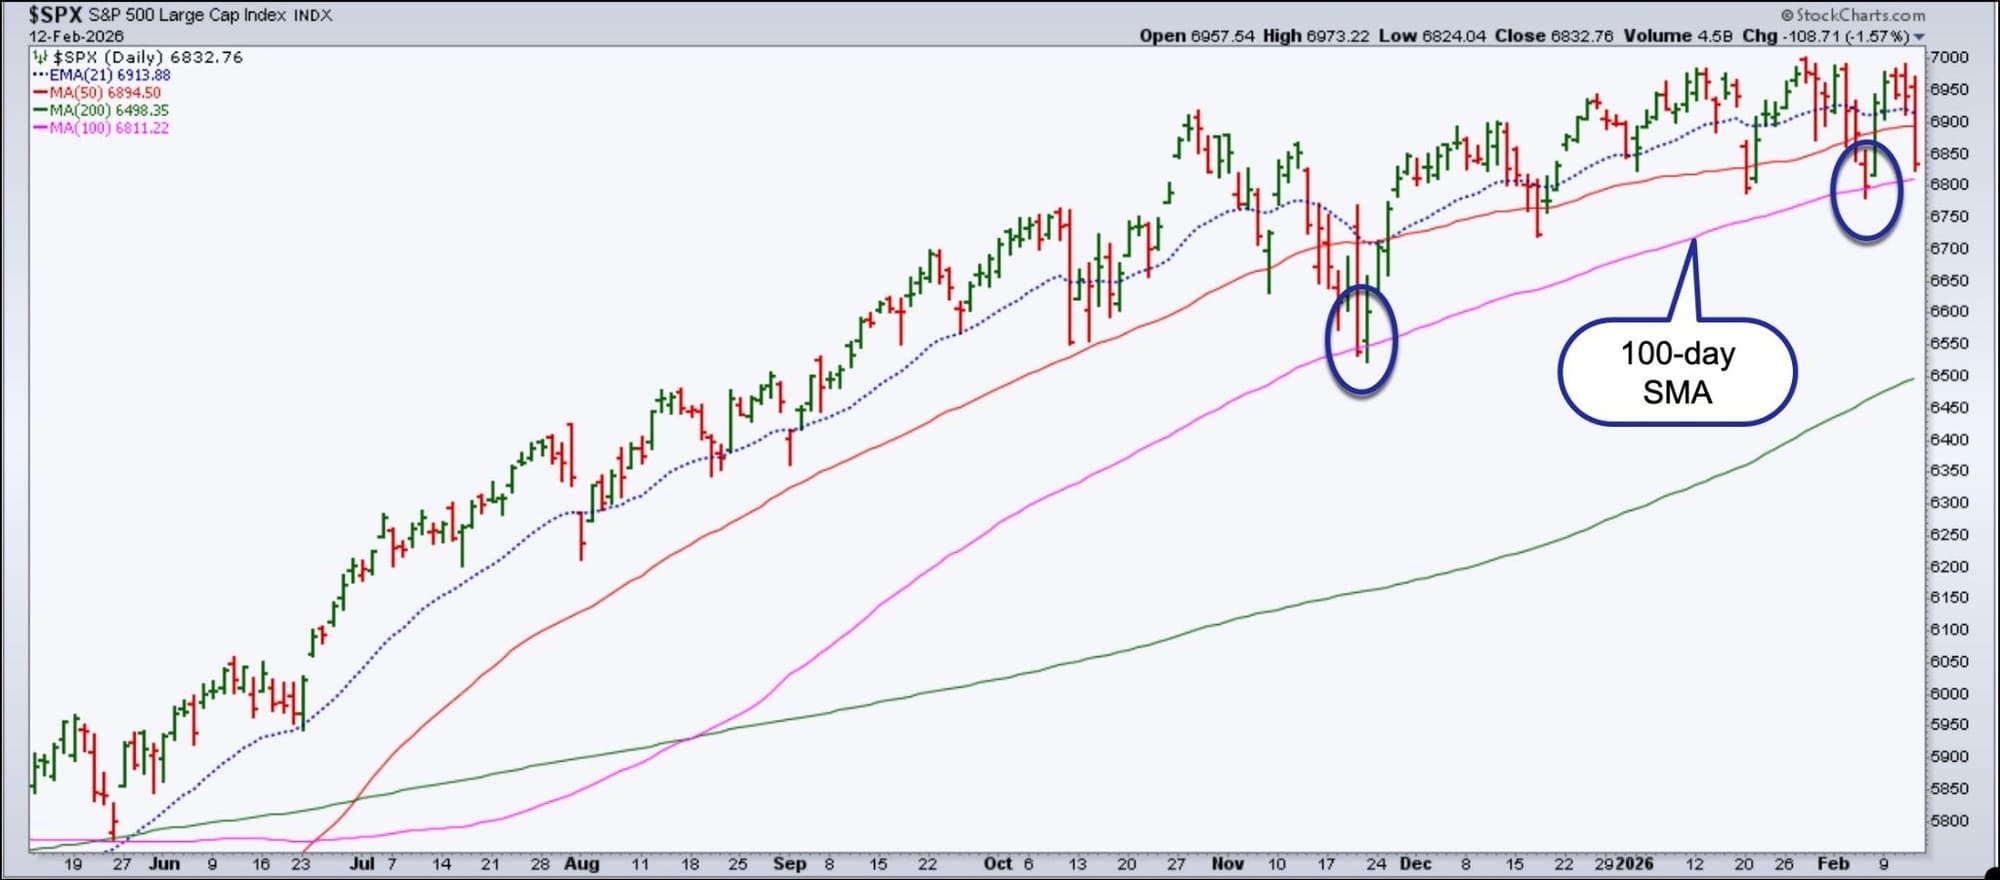
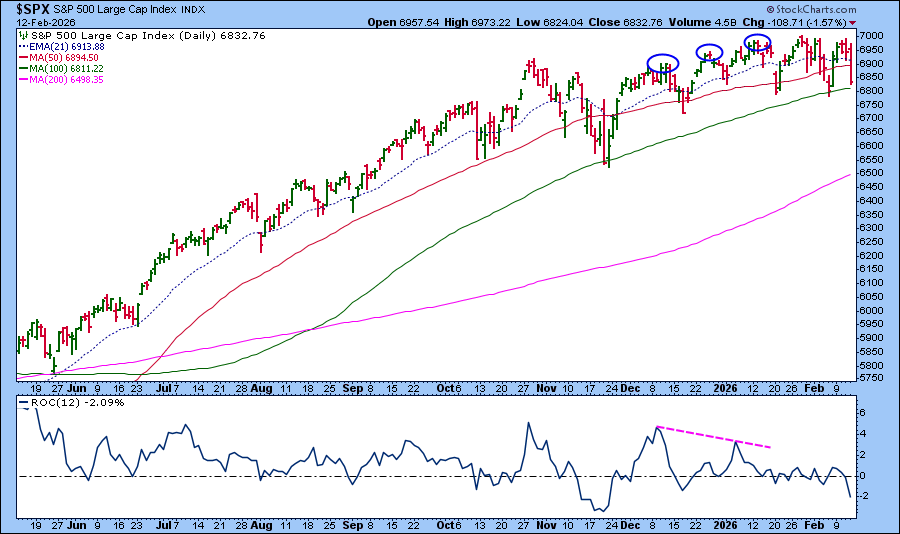
The S&P 500: A Key Support Test
The S&P 500 ($SPX) is approaching its 100-day Simple Moving Average (SMA). Looking at past price action, the index bounced off this moving average in November 2025 and again in February 2026. Will it follow a similar pattern this time? Watching the price action at this level can give valuable clues about whether buyers still have the upper hand.
A big surprise was that the Dow Jones Transportation Average ($TRAN) took a sharp hit on Thursday after what had been a resilient rally. We saw similar price action in gold and silver earlier in the year, and the two continue to struggle.
The Bigger Concern
The real technical caution flag is flying over the Nasdaq Composite ($COMPQ) and Nasdaq 100 ($NDX). In the long- and intermediate-term charts, both are moving sideways. On the daily chart, though, they’re trading below their 21-day Exponential Moving Average (EMA), which is starting to display a negative slope. In the chart below, note that the 21-day EMA has crossed below the 50-day SMA, a sign of a momentum shift.
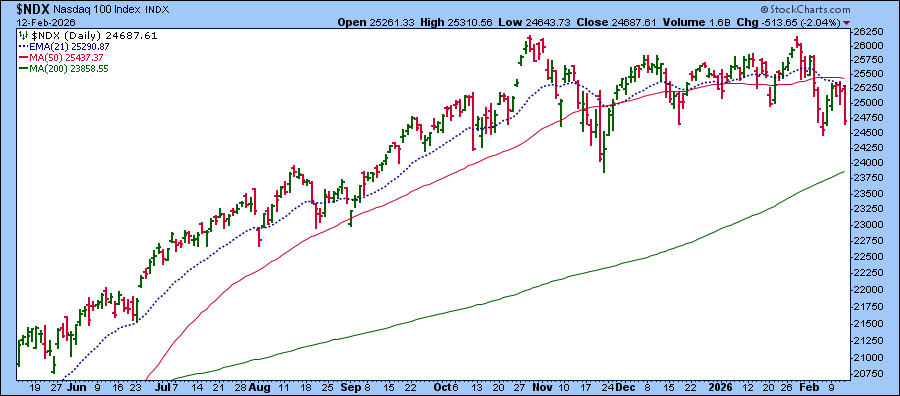
Since late October 2025, the Nasdaq 100 has been grinding sideways. Note that the 21-day EMA has remained above the 40-day SMA up until early February 2026. That has now changed.
QQQ at Key Support
If you analyze the daily chart of the Invesco QQQ Trust (QQQ), which tracks the Nasdaq 100, you’ll notice that since October 29, 2025, the 14-period Relative Strength Index (RSI) has been oscillating between 30 and 70. It has been a range-bound market.
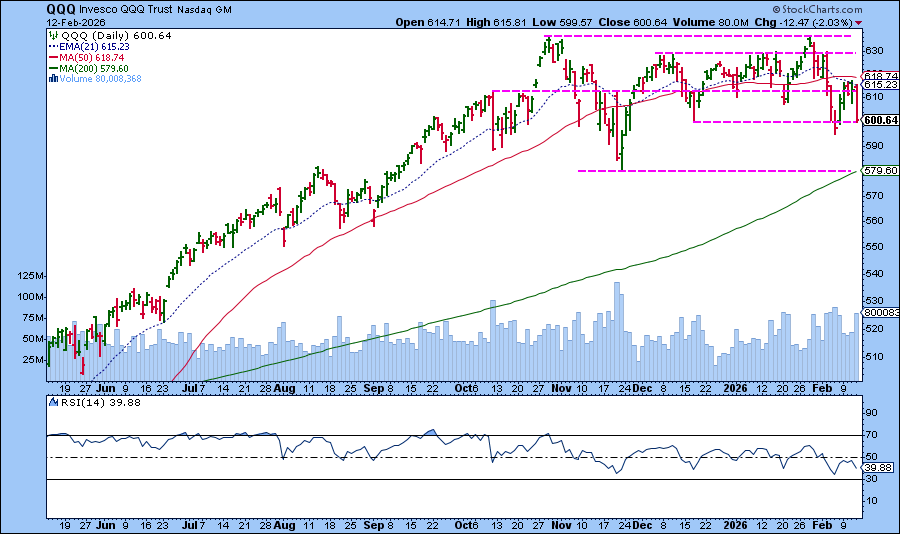
The pink dashed horizontal lines represent various support and resistance levels. As of Thursday’s close, QQQ was around the 600 level, which coincides with the December low. Will it bounce off this level or break below it? The price action at these levels will indicate whether bulls or bears are in control.
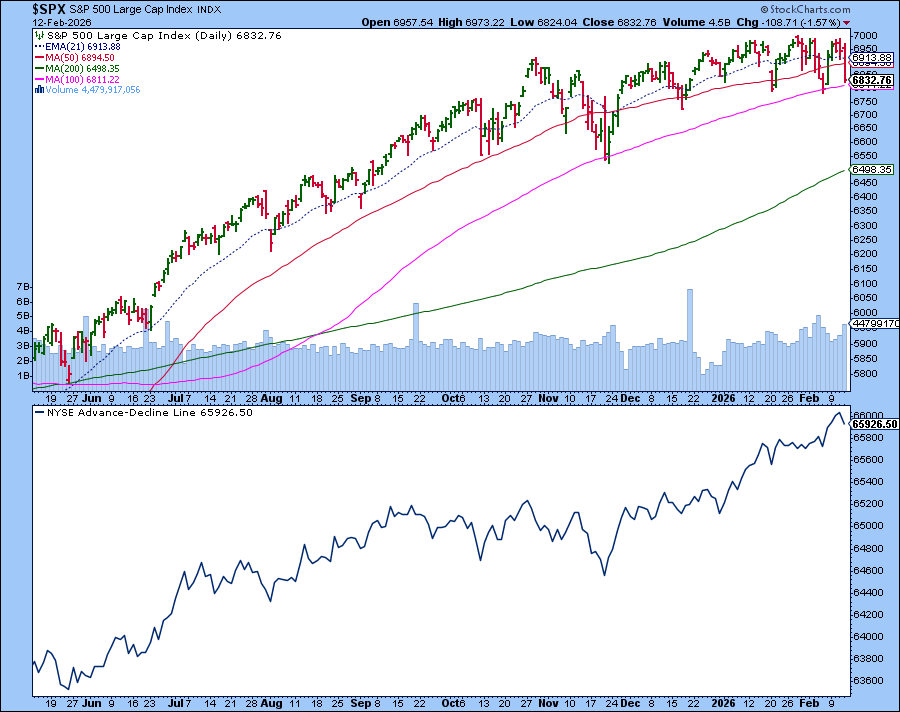
What’s Happening Beneath the Surface?
Here’s where things get interesting.
The Advance-Decline Line has generally been trending higher, indicating there are more advancing issues than declining ones. In the chart below, you can see that while there was a slight dip in the 12-day NYSE A/D Line after Thursday’s selloff, it’s generally trending higher. Meanwhile, the S&P 500 is trading sideways. Since the NYSE Composite has a broader representation of stocks, both domestic and global, this suggests that advances are likely from other asset groups besides U.S. large-cap growth stocks.
Also note that between December 9, 2025, and January 13, 2026, the S&P 500 was printing a series of higher highs while the Rate of Change (ROC) was declining. This divergence is worth paying attention to, especially since the ROC continues to decline. This doesn’t guarantee a decline, but it suggests the rally in US large-cap growth stocks may be losing steam.
Global Markets: A Bright Spot
Here’s something that many U.S.-focused investors may not have observed. Emerging Markets are bullish and outperforming the S&P 500. So are Asian, European, and Latin American markets.
Be sure to keep an eye on the Market Summary page, especially the Global Snapshot and Country Funds tabs in the Equities panel. With the January CPI data coming on Friday morning and a long weekend ahead, volatility could remain elevated.
What Should You Watch?
Monitor the price action at key support levels, especially the 100-day SMA for the S&P 500 and the 600 level in QQQ. Note whether advances continue to outpace declines, and if momentum continues to deteriorate.
If support breaks while breadth and momentum weaken further, we could see turbulence ahead. But if buyers step in and breadth favors the bulls, Thursday’s selloff may be another pullback in the sideways market we’ve seen since late October 2025.
Disclaimer: This blog is for educational purposes only and should not be construed as financial advice. The ideas and strategies should never be used without first assessing your own personal and financial situation, or without consulting a financial professional.


