Breadth Weakness Raises Red Flags in September

While the S&P 500 and Nasdaq 100 minted a steady stream of new highs through the summer, the early fall is bringing colder breadth readings to match the chillier temperatures. One market breadth indicator in particular, measuring moving average conditions for major equities, has been in a steady downtrend since the end of June.
Today, we’ll dig into the current moving average configuration for the S&P 500, break down the current moving average breadth readings relative to previous market cycles, and reflect on key warning signs to watch for into Q4.
The S&P 500 Remains Well Above Moving Average Support
The S&P 500 recently became overbought for just the fifth time in 2025. While this often rightly suggests caution for investors in the short-term, overbought conditions often represent a stronger momentum situation and potential for further upside. This consistent price strength has pushed the SPX well above its 50-day and 200-day moving averages.
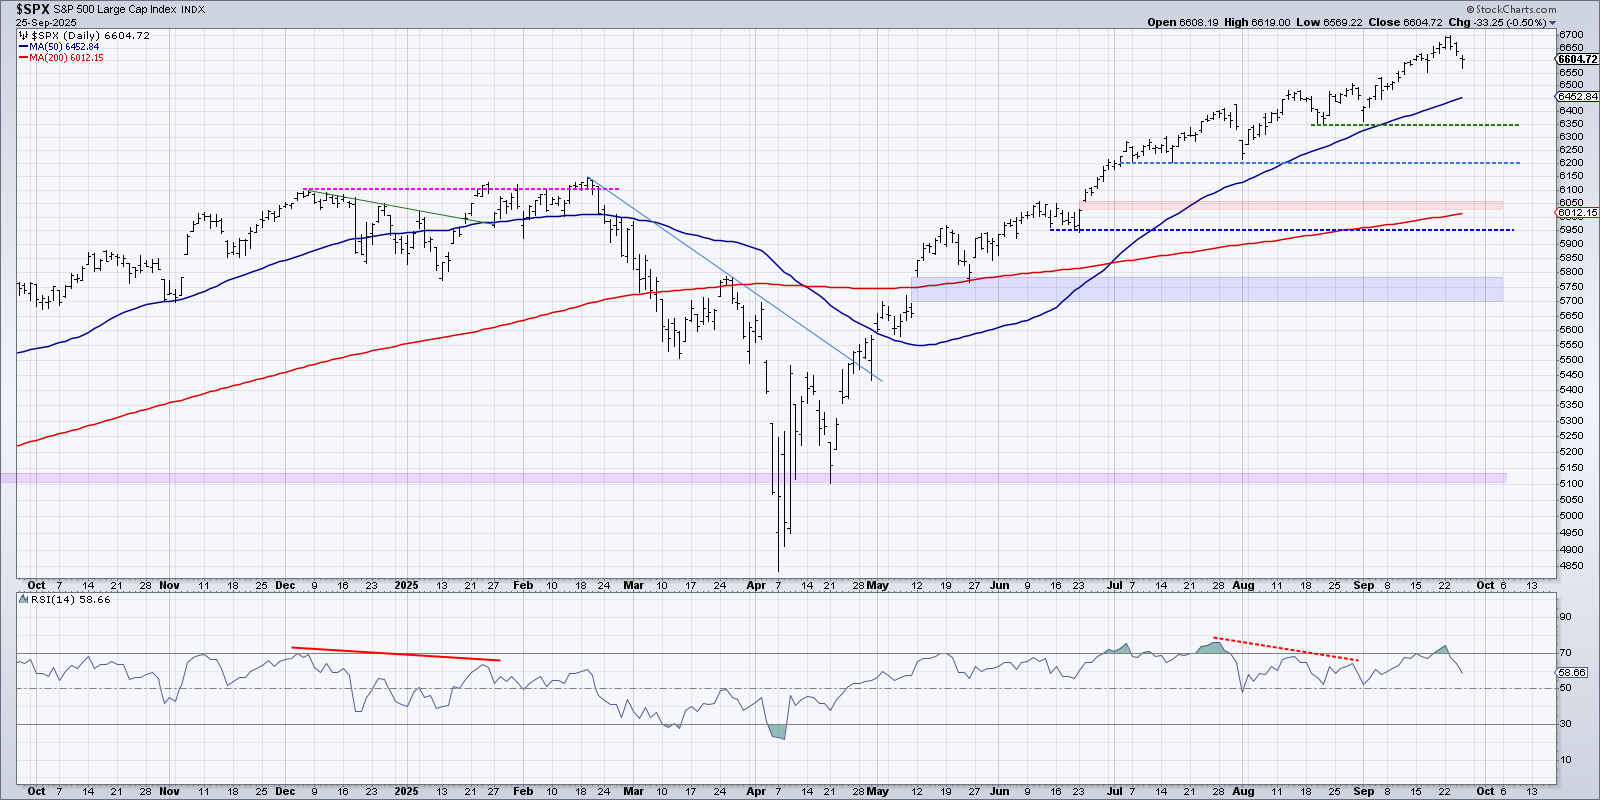
Technically savvy investors will often use the 50-day or 10-week moving average as a key indicator of trend strength. As long as the S&P 500 sits above an upward-sloping 50-day moving average, the trend remains constructive. Since breaking above the 50-day back in early May, the SPX has remained firmly above this short-term trend barometer.
So with the S&P 500 recently overbought and with the index well above its 50-day moving average, the equity markets would appear quite bullish on a surface level. Underneath the hood, though, we can see a steady deterioration in breadth support for this relentless uptrend phase.
S&P 500 Index Members are Showing Less Strength
We can use moving average breadth indicators to track where a large group of stocks are trading relative to their own moving averages. This chart shows the percentage of S&P 500 index members above their 50-day and 200-day moving averages.
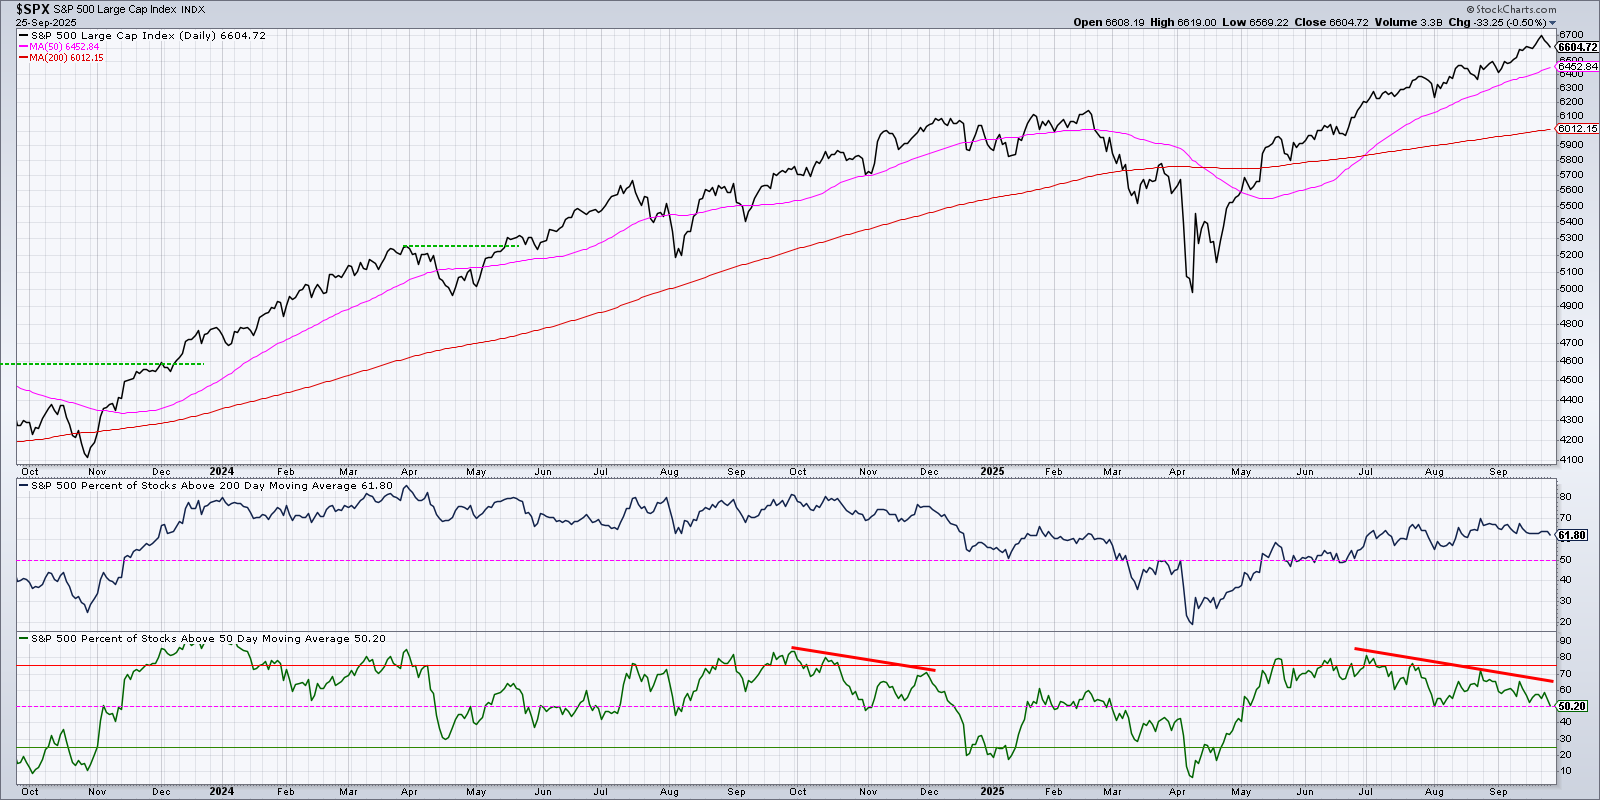
We can observe that even though the S&P 500 has indeed made new highs every month since May, each one of those peaks has been driven by fewer stocks trading above their 50-day moving average. At the end of June, this indicator was around 80%, but now it has dipped down to only 50%. That implies that almost a third of the S&P 500 members have broken their own 50-day moving average in the last quarter, even though the S&P 500 and Nasdaq 100 remain safely above this threshold.
Short-Term Readings are Already Bearish
The recently updated Market Summary page features a table of moving average breadth indicators, allowing us to compare readings on various US equity indices. Let’s focus in on the left column, showing the percentage of stocks above their 20-day moving average.
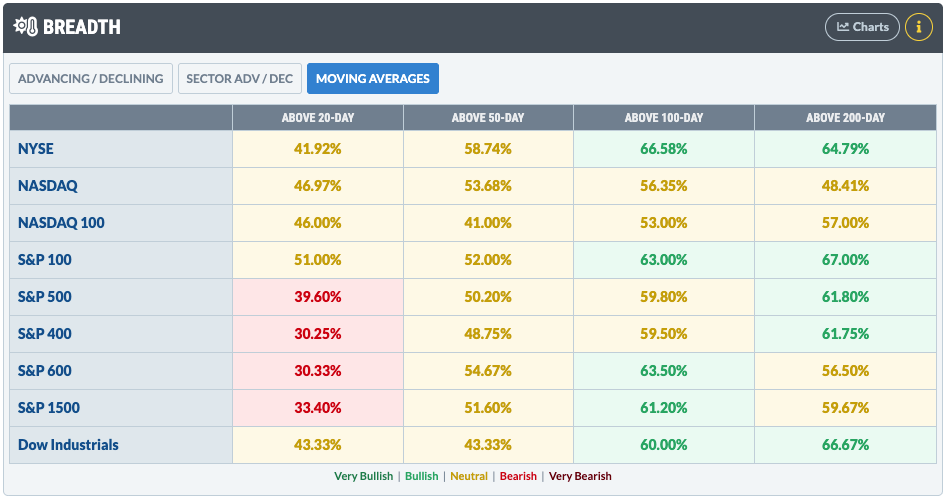
Even though 62% of the S&P 500 members are above their 200-day moving average, and about 50% are above the 50-day, less than 40% sit above their 20-day moving average. These readings were almost all in the green earlier this summer, but now we are seeing the short-term signals start to flash bearish red as stocks are struggling to sustain their gains from earlier in 2025.
As a trend follower, my primary goal is to track the overall trend for the S&P 500 and other major equity indexes and asset classes. While the uptrend still remains strong according to my Market Trend Model, deteriorating breadth indicators, such as these moving average breadth readings, tell us that a lack of breadth support could mean limited upside for risk assets.
RR#6,
Dave
P.S. Ready to upgrade your investment process? Check out my free behavioral investing course!
David Keller, CMT
President and Chief Strategist
Sierra Alpha Research
marketmisbehavior.com
https://www.youtube.com/c/MarketMisbehavior
Disclaimer: This blog is for educational purposes only and should not be construed as financial advice. The ideas and strategies should never be used without first assessing your own personal and financial situation, or without consulting a financial professional.
The author does not have a position in mentioned securities at the time of publication. Any opinions expressed herein are solely those of the author and do not in any way represent the views or opinions of any other person or entity.


