Stock Market Is on the Move: Here’s Where the Next Opportunity Could Be

Key Takeaways
- Strong earnings from industrial stocks helped push the Dow to a record high.
- After hitting record highs, gold prices saw their biggest one-day drop in the last year.
- With the stock market stretched and headlines driving investor sentiment, don't be surprised to see more volatility.
After a week of going nowhere in any rush, the stock market finally seems ready to stretch its legs. The S&P 500 ($SPX) has just about wiped out the losses from that October 10 selloff, even though Tuesday was another quiet, narrow-range day.
Investors seem to have shrugged off last week’s credit-risk jitters. The Dow Industrials ($INDU) closed at a record high! Meanwhile, the S&P 500 finished flat, and the Nasdaq Composite ($COMPQ) slipped a bit. The S&P 500 closed unchanged while the Nasdaq closed lower.
Earnings Still Strong
Earnings season is keeping the market active. Strong numbers from GE Aerospace (GE), General Motors (GM), Raytheon Technologies (RTX), and Coca-Cola (KO) helped push these stock prices higher. No surprise the Dow hit that all-time high.
There are a lot more earnings coming up. Among some of the heavy hitters are Intel Corp. (INTC), Tesla (TSLA), Netflix (NFLX), and Ford (F). Netflix announced after the close. More on that below.
A Twist of Fate
After gold’s impressive rally, prices took a breather, dropping sharply on Tuesday, just a day after hitting a record high.
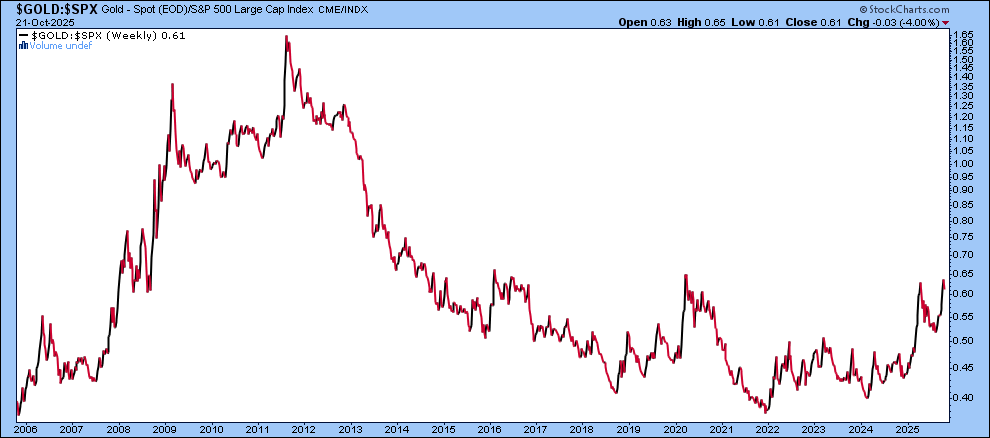
If you pull up a long-term chart of the gold-to-S&P 500 ratio, you’ll see that the ratio is close to the April 2024 level and approaching the 2020 one. From a long-term perspective, there’s still room for gold prices to rise relative to stocks. But both assets are overstretched, and when trends show signs of maturing, volatility tends to creep in. We’ve seen that play out recently in stocks and gold. Downward moves are more magnified than upward moves.
Demand for gold remains strong. Central banks are buying gold, jewelry demand is up, and physical gold investments continue to climb. Tuesday’s big red candle was the largest red candle we’ve seen in at least a year. You’ll have to go back much further to see a selloff of that magnitude. Does Tuesday’s gold selloff mean the ride is over for now, or is it merely a pullback that will reverse and move back up?
Looking at the daily chart of SPDR Gold Shares (GLD), note that the price gapped down and fell more than 6%. GLD is holding the support of its October 13 low. The Relative Strength Index (RSI) is at around 58, and the Moving Average Convergence/Divergence (MACD) is showing signs of decreasing momentum.
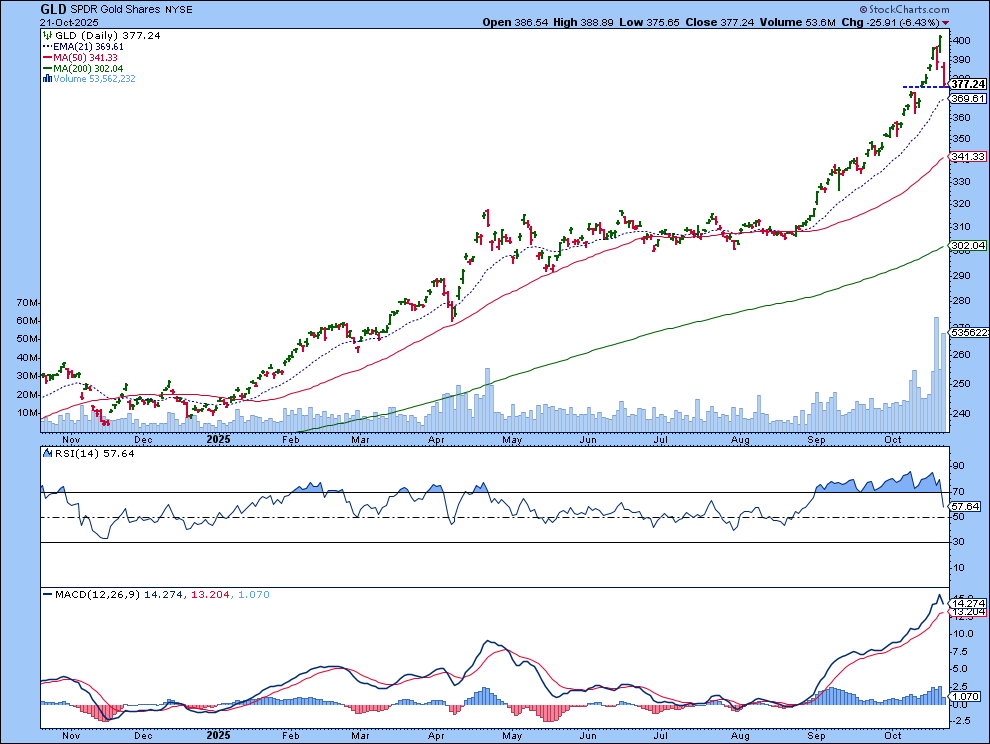
If you missed the recent gold run, I would watch the charts closely, since there could be another opportunity to get in on either gold or gold mining stocks. Just be patient and allow prices to settle down before jumping in. A little more downside wouldn’t be out of the question.
A Quick Look at Newmont (NEM)
Newmont Mining (NEM), a gold mining stock that had been riding the gold trend, dropped even harder than GLD or gold futures. The chart of NEM below shows that NEM hit a high four trading days ago. It’s now trading below its 21-day EMA, its RSI is at around 50, and the MACD line has just crossed below the signal line.
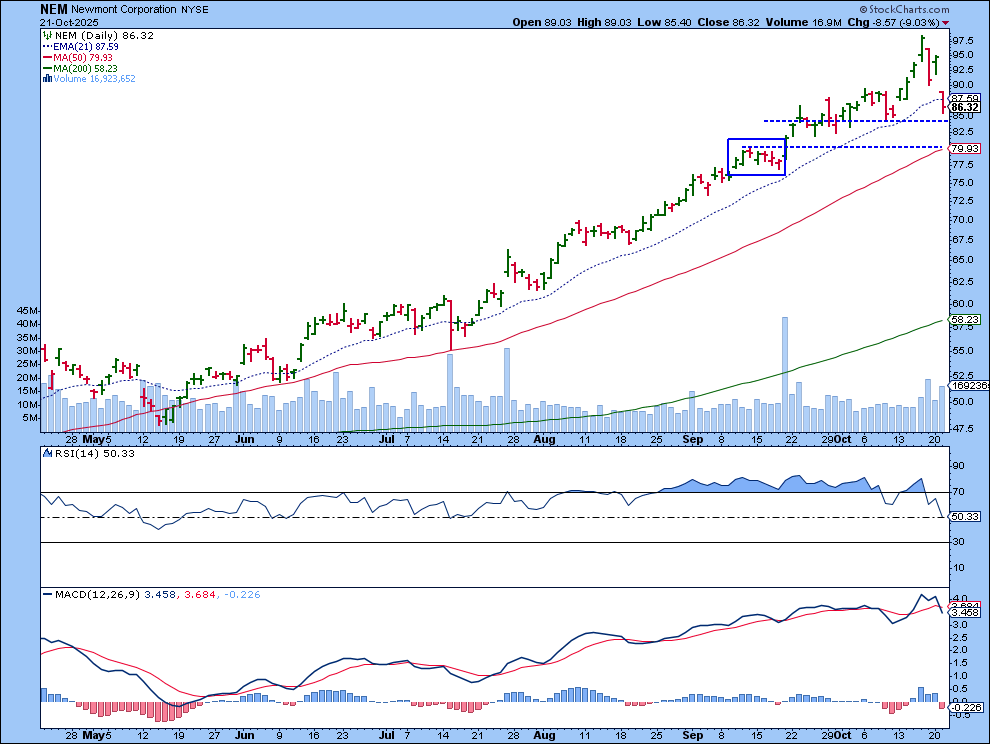
Keep an eye on the October 9–10 low, which could be the first level of support. If that doesn’t hold, the 50-day SMA might be the line in the sand. Note that it coincides with the September 11–18 consolidation.
With equities now rising and precious metal prices falling, it feels as if the two assets are behaving the way they should. But remember, it’s still a headline-driven market. If trade tensions flare up again or credit risk or other fears resurface, we could see investors quickly shifting to a risk-off mood.
Netflix’s earnings miss after the bell sent the stock’s price falling over 6% after the announcement. This could change investor sentiment on a dime.
Final Thoughts
We are in an overstretched market, which can get volatile. In a volatile environment, you have to be more diligent about how you manage your risks. Be sure to keep organized ChartLists so your daily routine of monitoring the market becomes less time-consuming.
Disclaimer: This blog is for educational purposes only and should not be construed as financial advice. The ideas and strategies should never be used without first assessing your own personal and financial situation, or without consulting a financial professional.


