Pullback or Pitfall? Let the 21-Day EMA Be Your Guide

How can we differentiate a garden variety pullback from a more painful corrective move? Personally, I tend to rely heavily on trend-following techniques, like moving averages, in order to gauge potential pullbacks and develop a game plan should the initial move continue to deteriorate into a confirmed downtrend.
I use the 21-day exponential moving average (EMA), in particular, to confirm trend phases. This article will give you a look at how I use this powerful trend-following tool, along with other moving averages, and why I argue it should be an essential risk management tool for traders.
Identifying Pullbacks Within an Uptrend Phase
To start, let’s compare the current price level to the 21-day exponential moving average. As long as the price remains above the 21-day EMA, any short-term movements can be considered noise, rather than a clear signal of a change in trend. Here’s the chart of the iShares Home Construction ETF (ITB) which shows how we can identify short-term pullback opportunities.
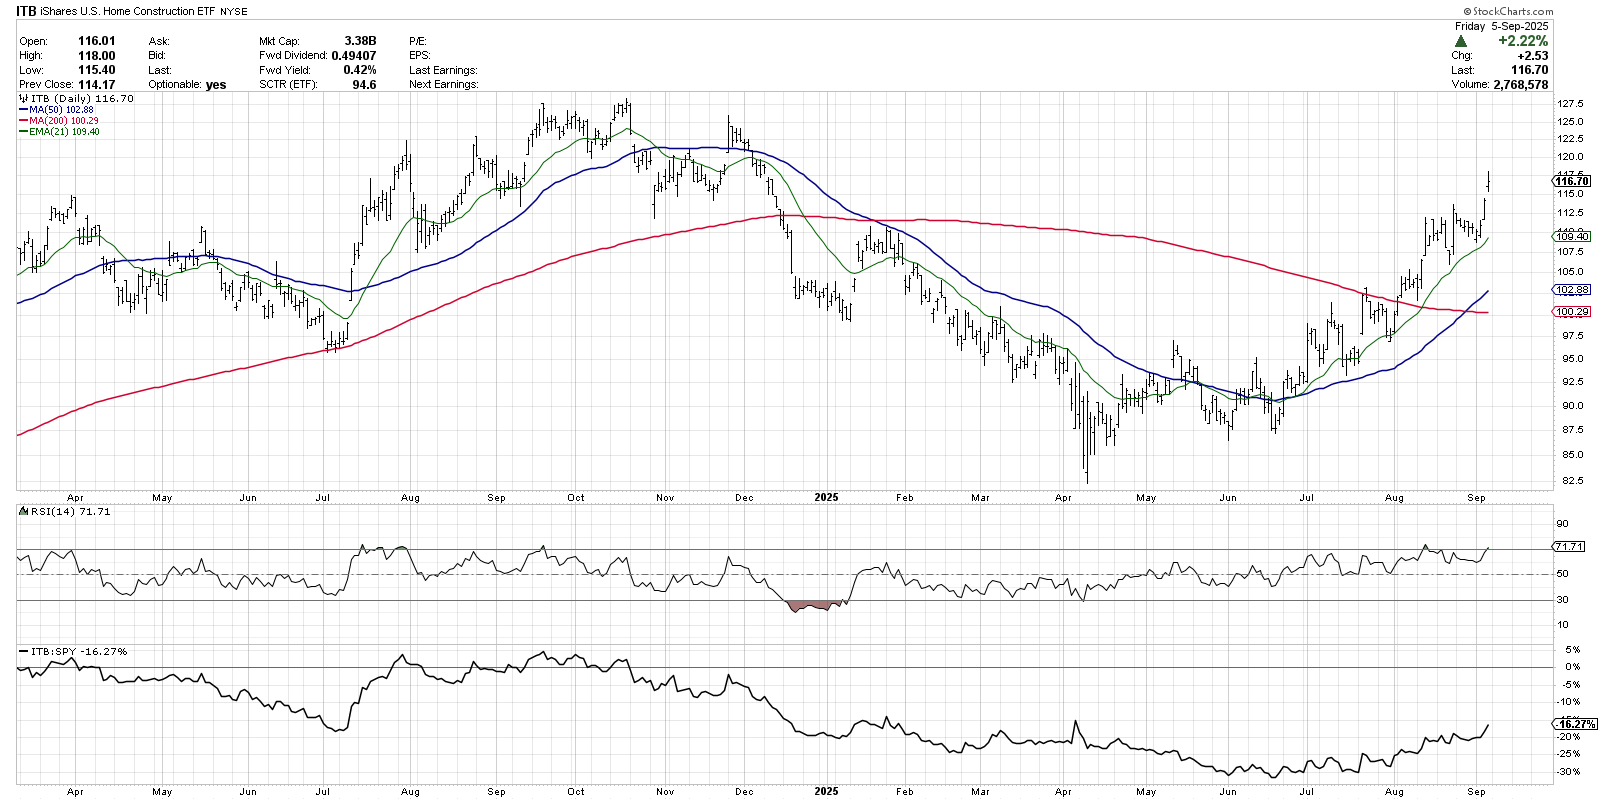
Off the April low, ITB stalled out in the mid-90 dollar range before pushing to a new swing high in early July. From that breakout point, we’ve observed five pullbacks where the price dropped down to at or around the 21-day EMA. With a stock in a primary uptrend, the 21-day can be used to identify short-term drops and potential entry points within the bullish phase.
The 50-Day Moving Average as Secondary Defense
We can also look at the slope of the moving average to understand a little more about how a price trend is evolving over time. Our next example, Ford Motor Co. (F), shows how a downturn in the 21-day EMA can serve to confirm a pullback phase that is developing into a more concerning downturn.
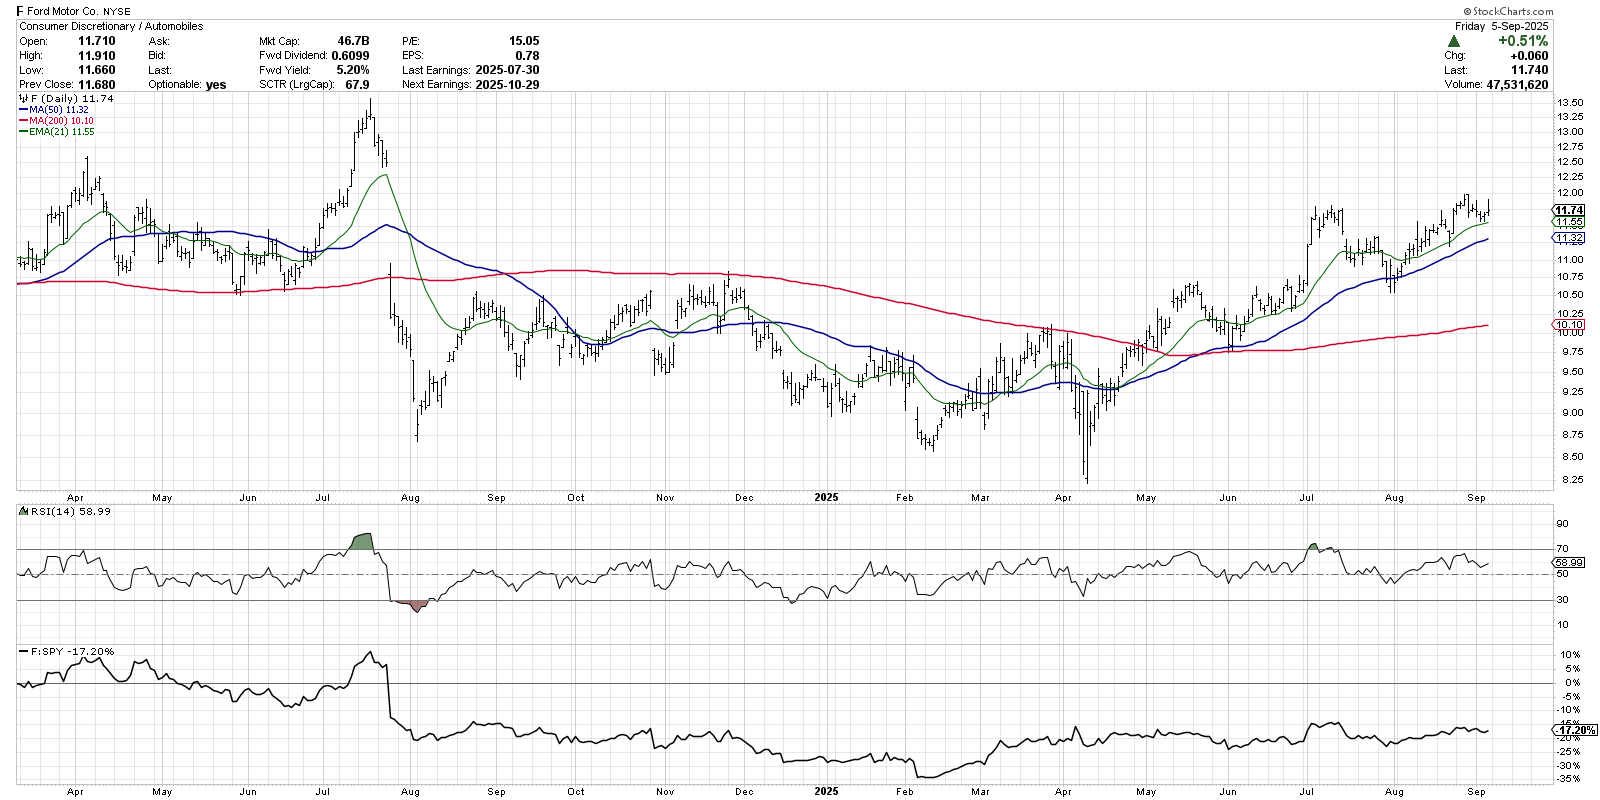
Similar to homebuilders, Ford rallied off the April low to break above moving average resistance. And although there were a number of pullbacks that stopped at the 21-day EMA, price drops in May and July actually pushed below the moving average. The 21-day EMA then actually turned lower before the price finally found support at an ascending 50-day simple moving average.
I think of the 21-day EMA as the first line of defense, an initial stop within an uptrend phase. And if the 21-day does not hold, and then turns lower, I’m relying on the 50-day moving average to provide the necessary support to reverse the downside pressure. After a bounce off the 50-day moving average, a push back above the 21-day EMA is often a great sign that the primary uptrend has resumed.
A Break of Support Suggests a Change in Trend
This brings us to the worst-case scenario, where the price does not hold the 21-day EMA, the moving average turns lower, and then the 50-day moving average does not provide support. Nvidia Corp (NVDA) provides a classic example of this downside rotation back in Q4 2024.
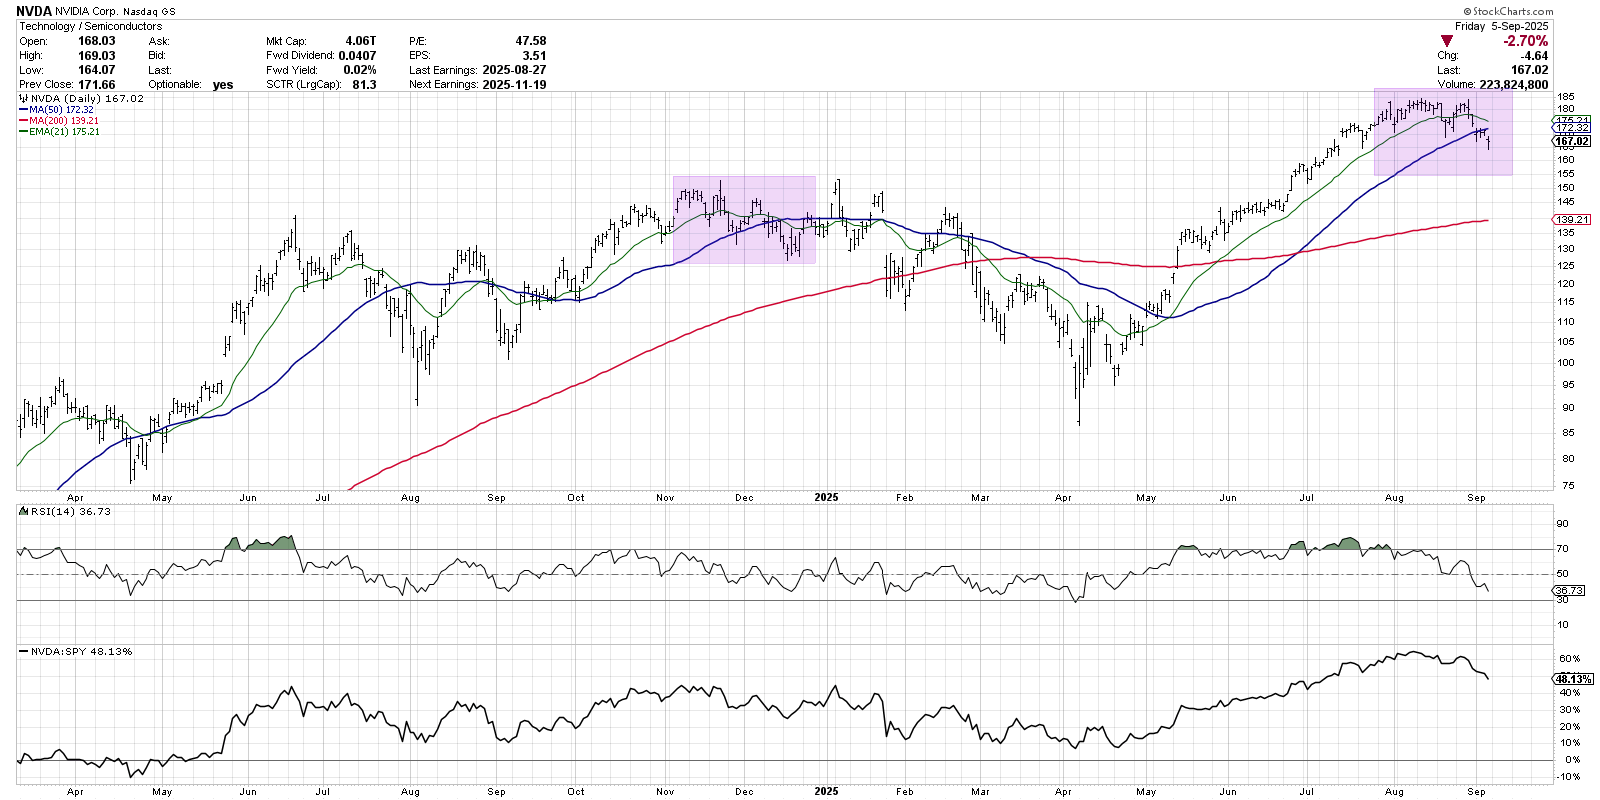
After the 50-day moving average was violated, we can see that both the 21-day EMA and 50-day SMA flattened. The Relative Strength Index (RSI) was stuck in a range between 40 and 60, confirming a sideways price structure. And while NVDA did eventually break above the moving averages to test the upper end of the price range, another downturn pushed the stock down to the 200-day moving average.
Notice the shape of the moving averages in June and July 2025. The price is above the 21-day EMA, the 21-day is above the 50-day SMA, and the 50-day is above the 200-day SMA. With the moving averages in the “proper order”, this tells us the stock is in a confirmed uptrend.
As we now move into September, we can see that NVDA has broken both the 21-day EMA and 50-day SMA, similar to what we noted in December 2024. Now that the moving averages no longer in the proper order, a breakdown in price and momentum appears to confirm that Nvidia is in a short-term downtrend phase. While the 200-day moving average could serve as support, I’m inclined to consider this chart “guilty until proven innocent.”
RR#6,
Dave
P.S. Ready to upgrade your investment process? Check out my free behavioral investing course!
David Keller, CMT
President and Chief Strategist
Sierra Alpha Research
marketmisbehavior.com
https://www.youtube.com/c/MarketMisbehavior
Disclaimer: This blog is for educational purposes only and should not be construed as financial advice. The ideas and strategies should never be used without first assessing your own personal and financial situation, or without consulting a financial professional.
The author does not have a position in mentioned securities at the time of publication. Any opinions expressed herein are solely those of the author and do not in any way represent the views or opinions of any other person or entity.


