Offense Still Crushing Defense

It feels as if the market has gone through a number of different phases since the April low. One of the ways we can delineate these unique periods over the last five months is by analyzing market leadership. And no matter if you’re wildly bullish, cautiously optimistic, or somewhere in between, it’s important to pay close attention to the evidence and how it’s evolved.
With that in mind, here are some of the charts from my Market Misbehavior LIVE ChartList, which I watch closely for signs of leader shifts during a potential transition period.
Things You Want vs. Things You Need
First off, we can analyze the relationship between the offense and defense within the consumer sectors. Consumer Discretionary stocks, particularly industries like luxury retail and travel and tourism, often experience strong gains when consumers have the money and flexibility to spend on things they want but don’t necessarily need. The Consumer Staples sector, by contrast, tends to be less sensitive to economic conditions, because people tend to spend fairly consistent amounts on things like beverages, tobacco, cleaning products, and personal care.
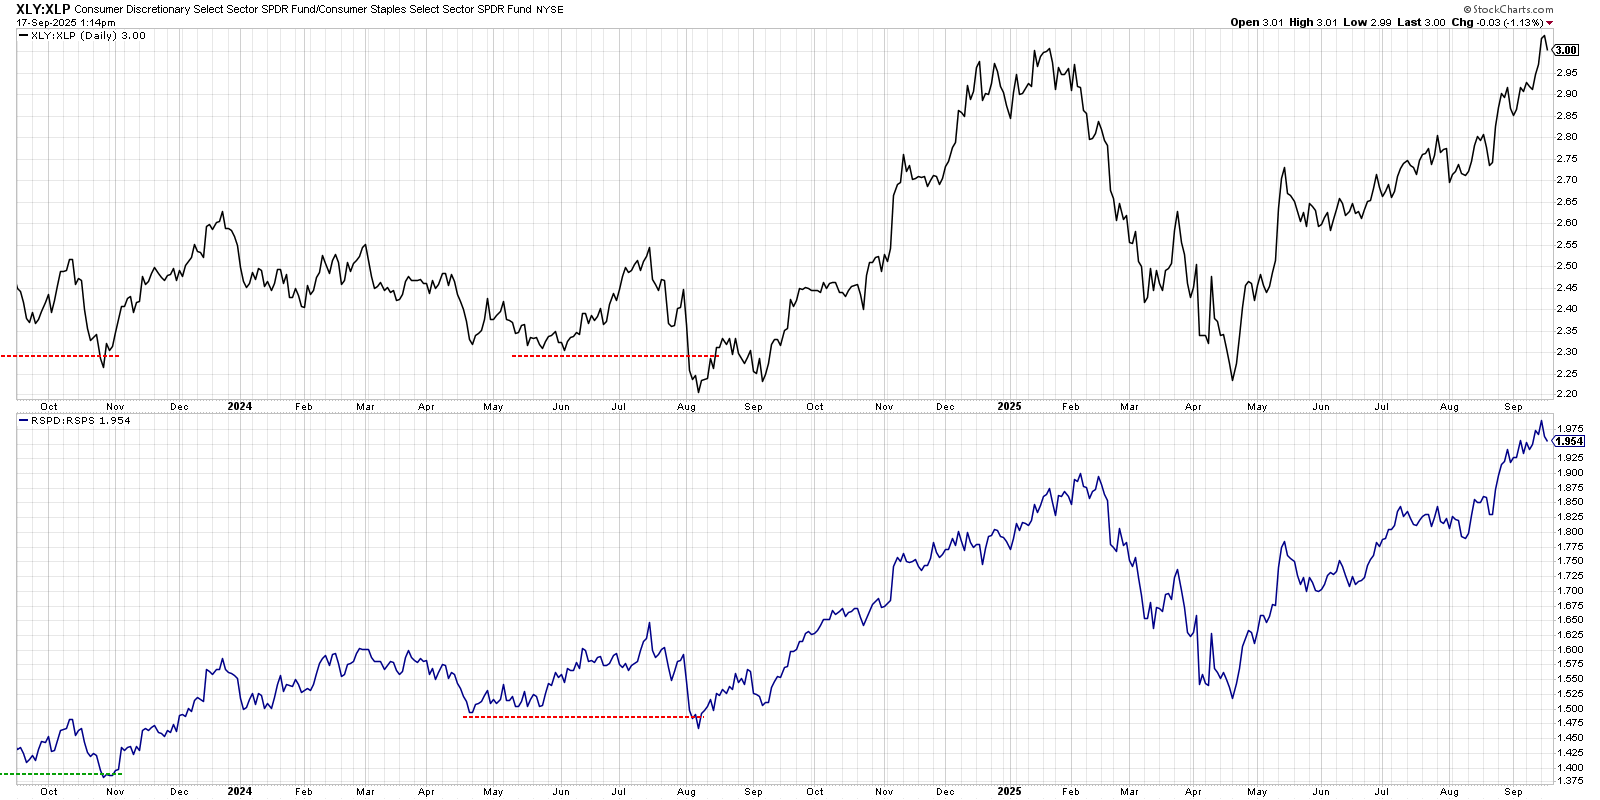
We’re showing the ratio of Consumer Discretionary to Consumer Staples using both cap-weighted and equal-weighted ETFs. As you can see, this ratio has been trending higher consistently since the April low, suggesting that “things you want” are outperforming “things you need.”
If and when these ratios turn lower, that would suggest investors are leaning more defensively in anticipation of some slowdown in consumer behavior. For now, however, the market is pretty much in a risk-on situation as consumers are expected to spend more.
Growth Still Dominates in Relative Strength
Toward the end of an extended bull market phase, one of the warning signs I look for is an uptick in the relative strength of defensive sectors. Similar to the first chart, it implies that institutional investors (a.k.a. the “smart money”) are rotating to more defensive areas of the equity markets.
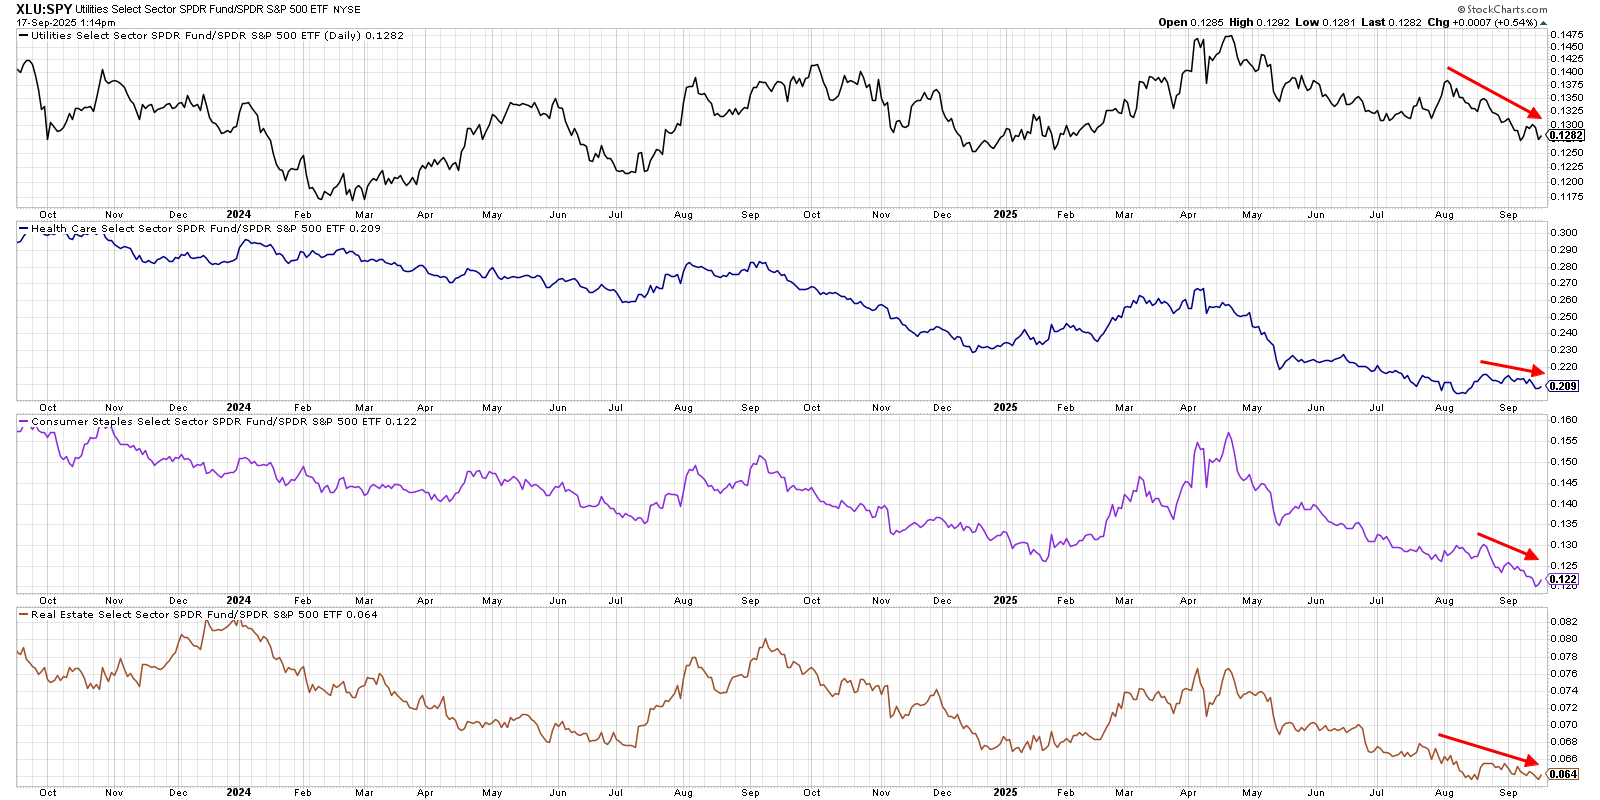
Here we’re showing the relative performance of each of the four defensive sectors — Utilities, Health Care, Consumer Staples, and Real Estate — relative to the S&P 500. We can see that all four of these lines have been trending lower in the last month, demonstrating that there has been no broad rotation to more defensive positions.
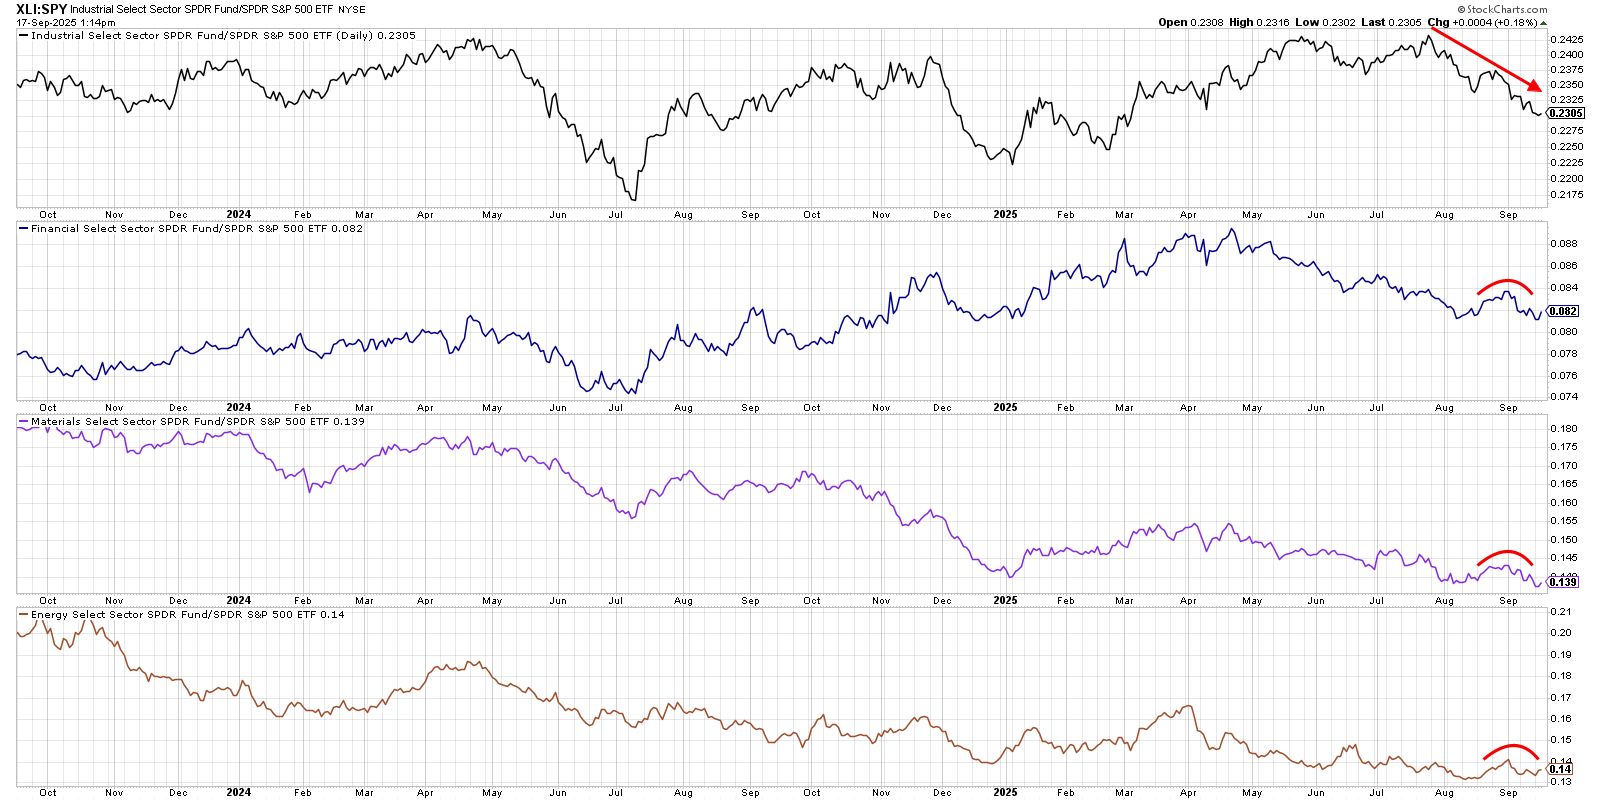
So have investors been rotating more to value-oriented or “cyclical” sectors since the Technology sector stalled out in August? We can see that the Industrial sector has been in a consistent relative downtrend since the end of July. The other three value sectors — Financials, Materials, and Energy — did improve in late August before rotating lower so far in September.
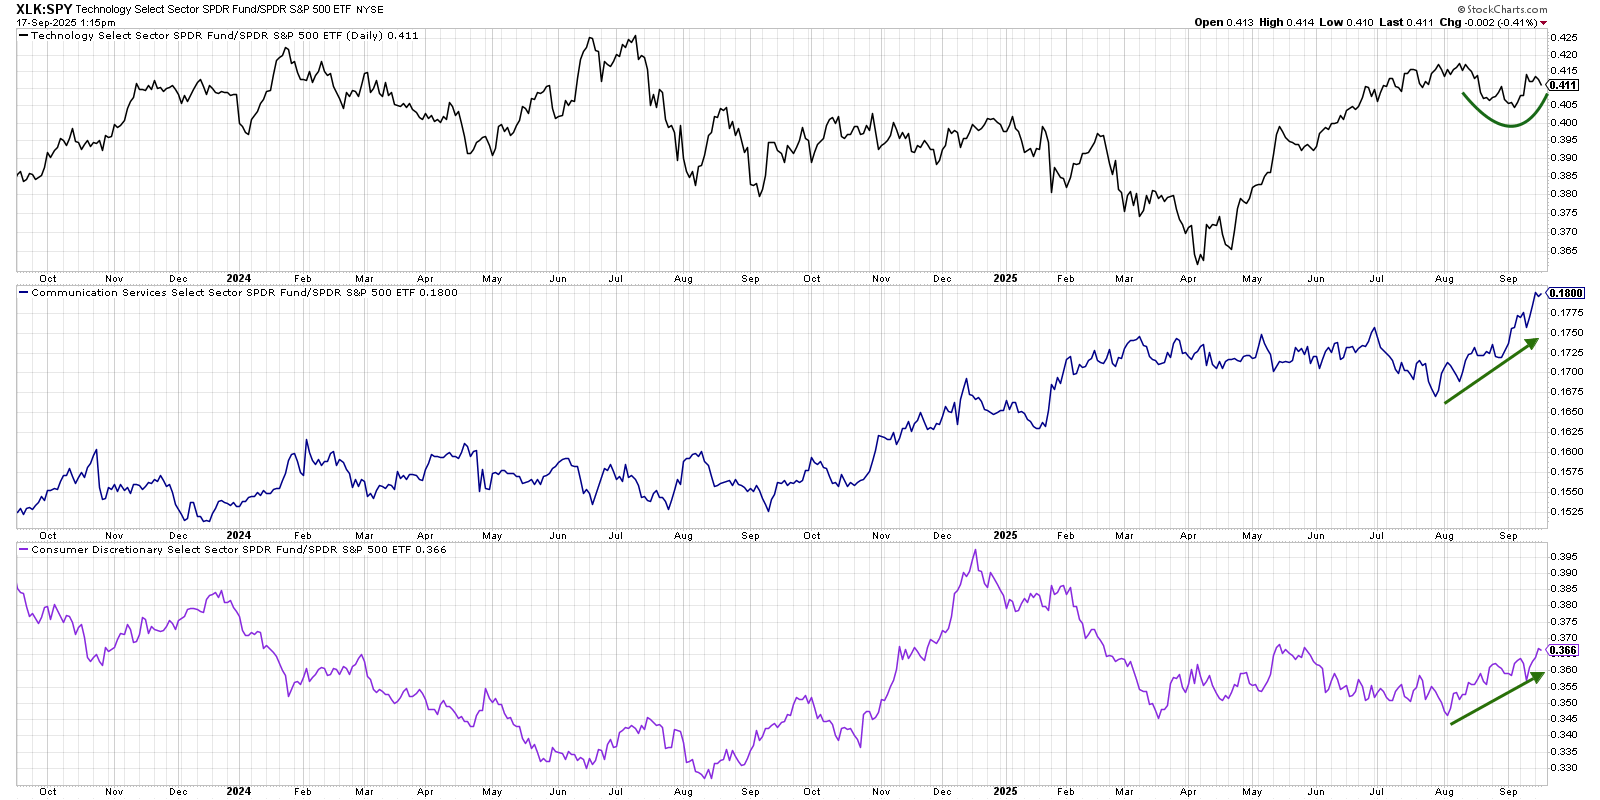
Our next chart shows where the money has been rotating in August and September, as both the Communication Services and Consumer Discretionary sectors have thrived, while Technology has paused in its dominating leadership role. So investors have essentially rotated from growth to other growth sectors, as opposed to value or defensive plays.
Using the RRG to Identify Leadership Changes
While I enjoy regularly reviewing all of the above charts with my Market Misbehavior premium members (use code STOCKCHARTS at checkout for 30% off your first 12 months!), I'm also a fan of making life easier with powerful data visualization techniques such as the Relative Rotation Graphs.
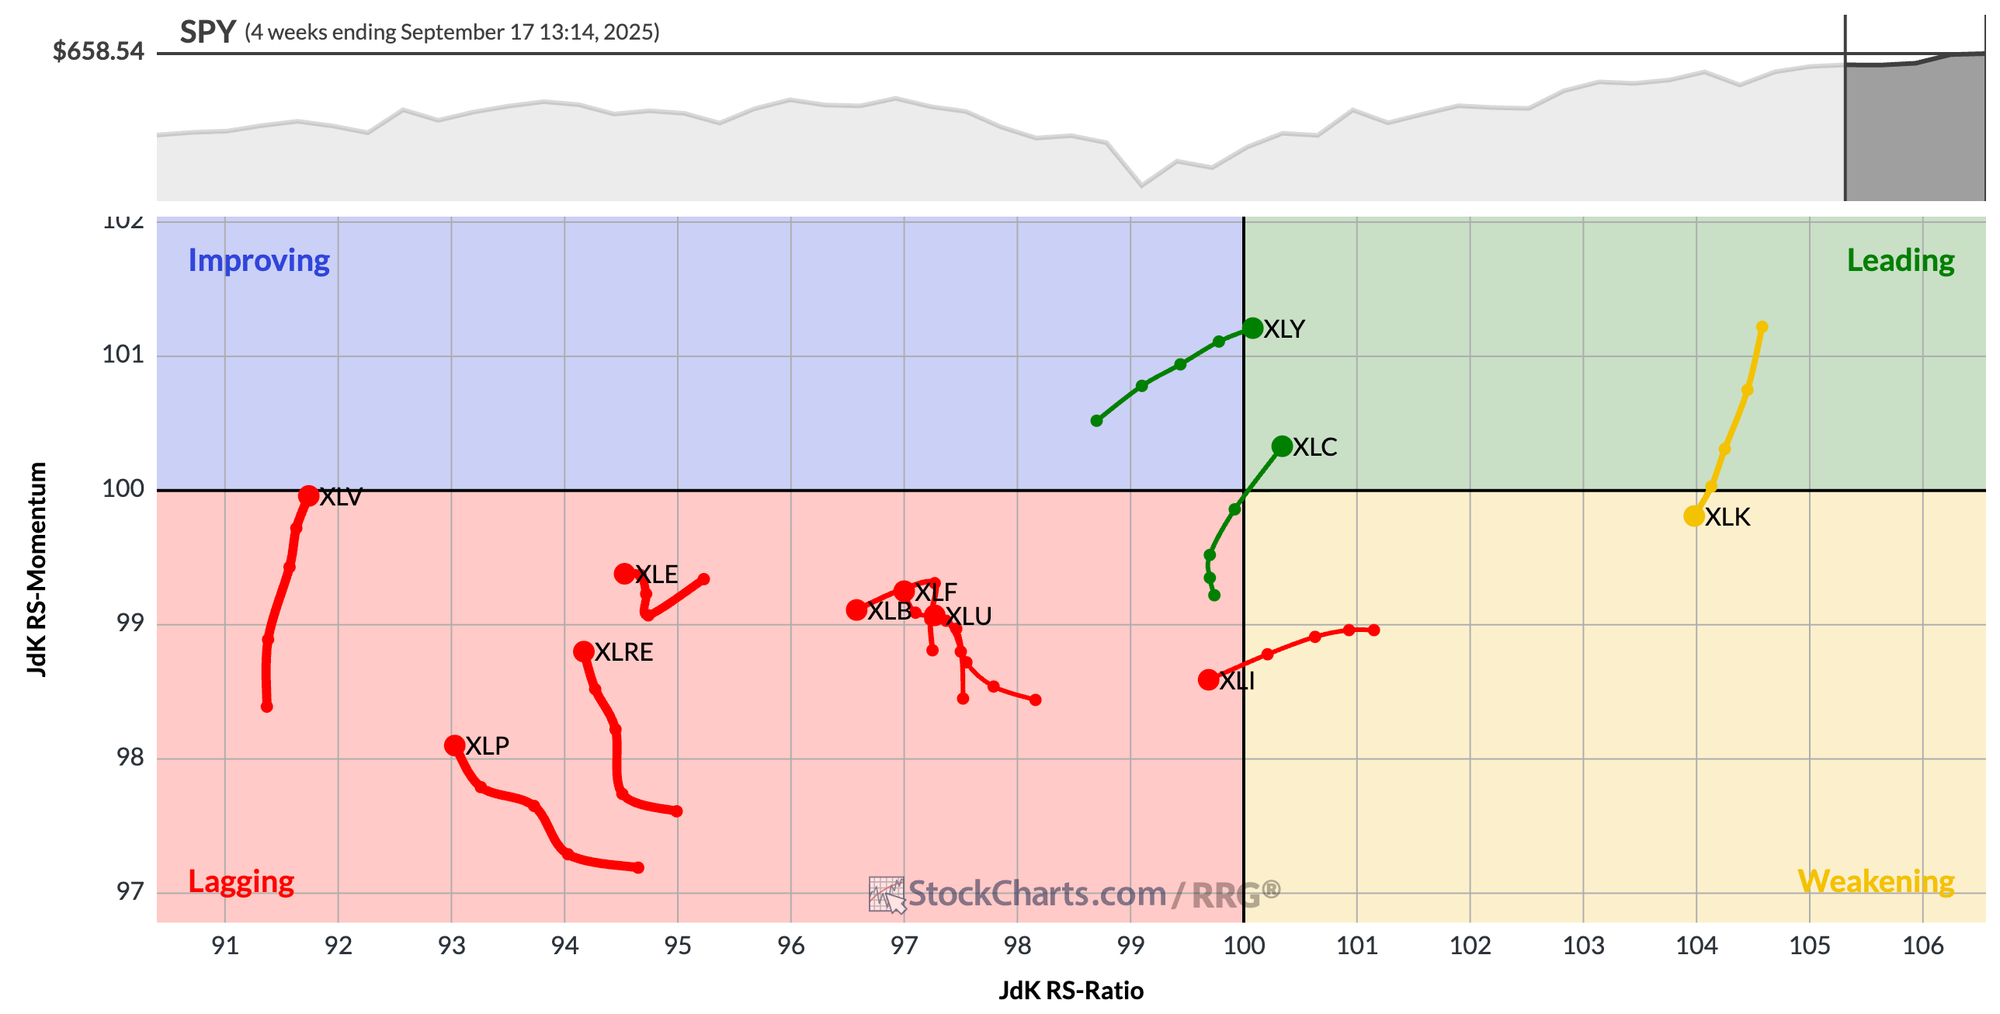
In this one chart based on weekly relative performance data, I can see that Technology has slowed down, but still dominates on a relative basis. I can also observe that the other growth sectors are trending up and to the right, recently entering into the Leading quadrant.
For now, this market remains clearly tilted toward strength in the growth sectors. At some point, investors will rotate assets into other sectors, confirming a leadership rotation. By regularly reviewing this set of charts, mindful investors can respect the trend and identify areas of emerging leadership.
RR#6,
Dave
P.S. Ready to upgrade your investment process? Check out my free behavioral investing course!
David Keller, CMT
President and Chief Strategist
Sierra Alpha Research
marketmisbehavior.com
https://www.youtube.com/c/MarketMisbehavior
Disclaimer: This blog is for educational purposes only and should not be construed as financial advice. The ideas and strategies should never be used without first assessing your own personal and financial situation, or without consulting a financial professional.
The author does not have a position in mentioned securities at the time of publication. Any opinions expressed herein are solely those of the author and do not in any way represent the views or opinions of any other person or entity.


