The Stock Market May Be Waking Up: It’s Not Just Tech Anymore

Key Takeaways
- After four down days, the S&P 500 closed higher, ending the week with hope of a Santa Claus Rally.
- Technology wasn’t the main driver on Friday, and within tech, semis did the heavy lifting while software stocks were hit hard.
- Emerging markets and value stocks are trending higher with healthy momentum, and Industrials are showing signs of building a bigger 2026 theme.
After four straight down days, the S&P 500 ($SPX) finally managed to squeeze out a gain on Friday. While a 0.19% may not sound like a big deal, when the thought of no Santa Claus Rally surfaces, even a small gain can feel like a ray of sunshine.
And yes, it gives us at least a sliver of hope that Santa may still be planning a visit before heading to the North Pole.
What made Friday especially interesting is that mid- and small-cap stocks outperformed the S&P 500. The S&P 400 Mid-Cap Index ($MID) climbed 1.34% higher, which is a healthy move. What’s even better is that participation was broad, with the leading sectors being Energy, Industrials, and Materials. Consumer Discretionary and Communication Services lagged.
Emerging Markets: Quiet Strength Worth Watching
One area that continues to stand out is Emerging Markets. The iShares MSCI Emerging Markets ex China ETF (EMXC) has been showing impressive strength, trading above its 21-day Exponential Moving Average (EMA) since December 19 and doing so with rising momentum.
This is evident in the Relative Strength Index (RSI) and Percentage Price Oscillator (PPO) in the lower panels.
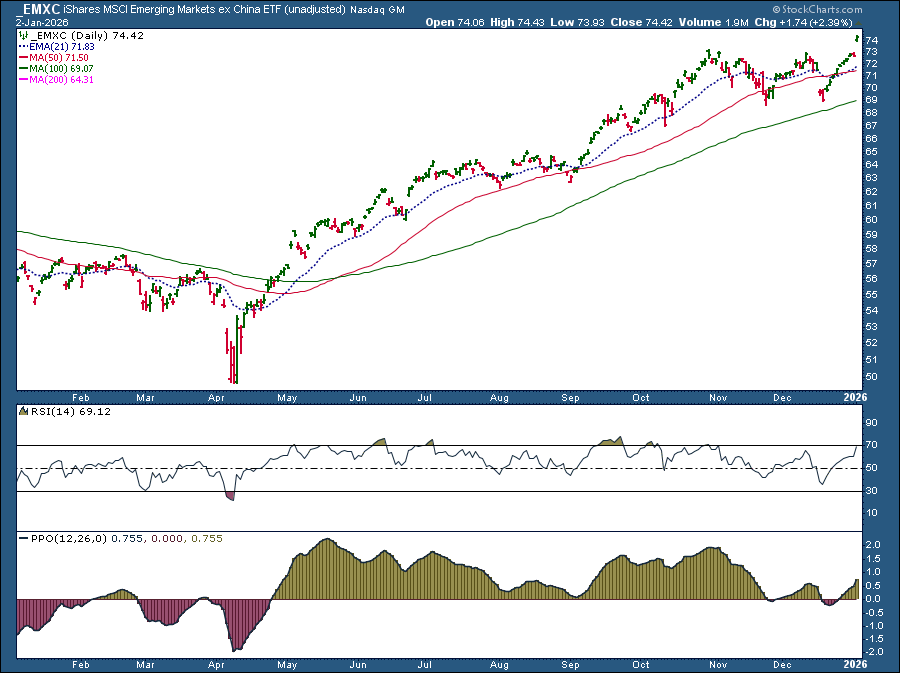
Even more notable is that EMXC is sitting at an all-time high. When you see momentum and new highs together, it’s usually a sign the trend deserves attention. Thai is definitely a chart worth keeping on your ChartList.
Value Stocks: Still Climbing Steadily
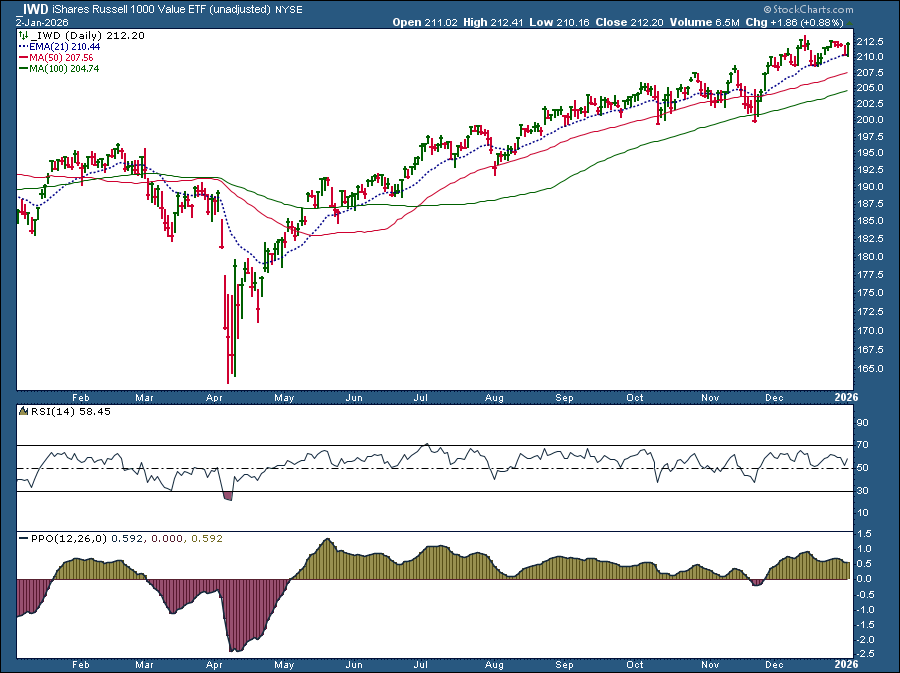
Another encouraging area is value stocks. The iShares Russell 1000 Value ETF (IWD) continues to drift higher, not necessarily in a flashy way but in a consistent and steady path. Right now, the RSI is moving sideways below 70, which suggests this rally could continue moving steadily higher. If the RSI starts to creep higher and move above 70, IWD could have room to accelerate.
Industrials: A 2026 Theme to Keep On Radar
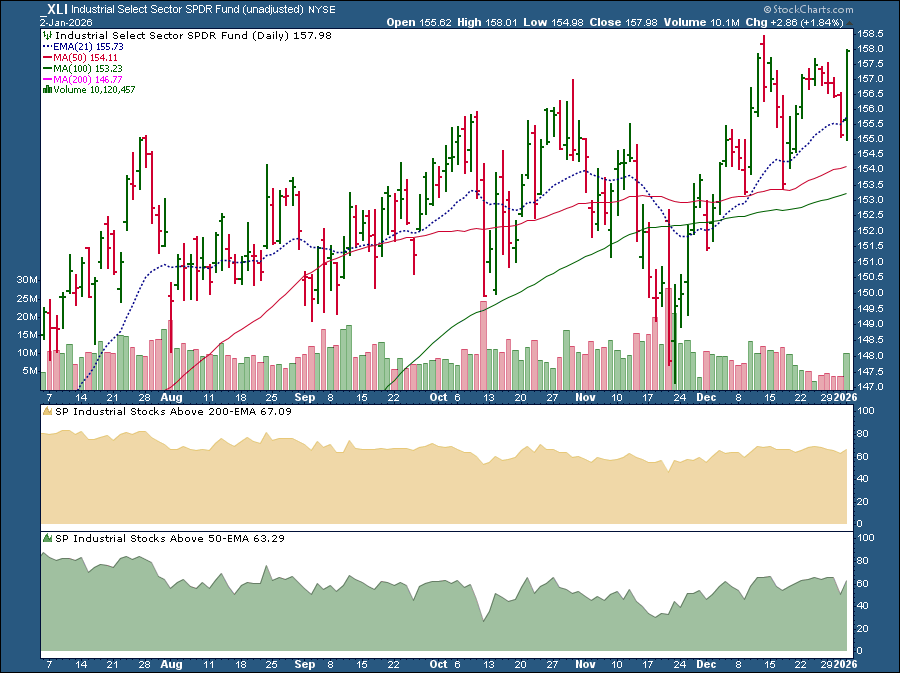
Another area not to overlook is Industrials. We’re seeing a combination of a volume spike and expanding breadth. That’s the kind of setup that could turn into a bigger theme, especially as we head into 2026.
Market Leadership May Be Broadening Beyond Tech
Friday’s price action suggests that investors may be willing to explore other areas of the market outside of technology, which did most of the heavy lifting in 2025. Although the Technology sector gained 0.23% on Friday, most of the gains came from Semiconductors. The StockCharts MarketCarpet of the Technology sector clearly shows that semis were strong while software was hit hard.
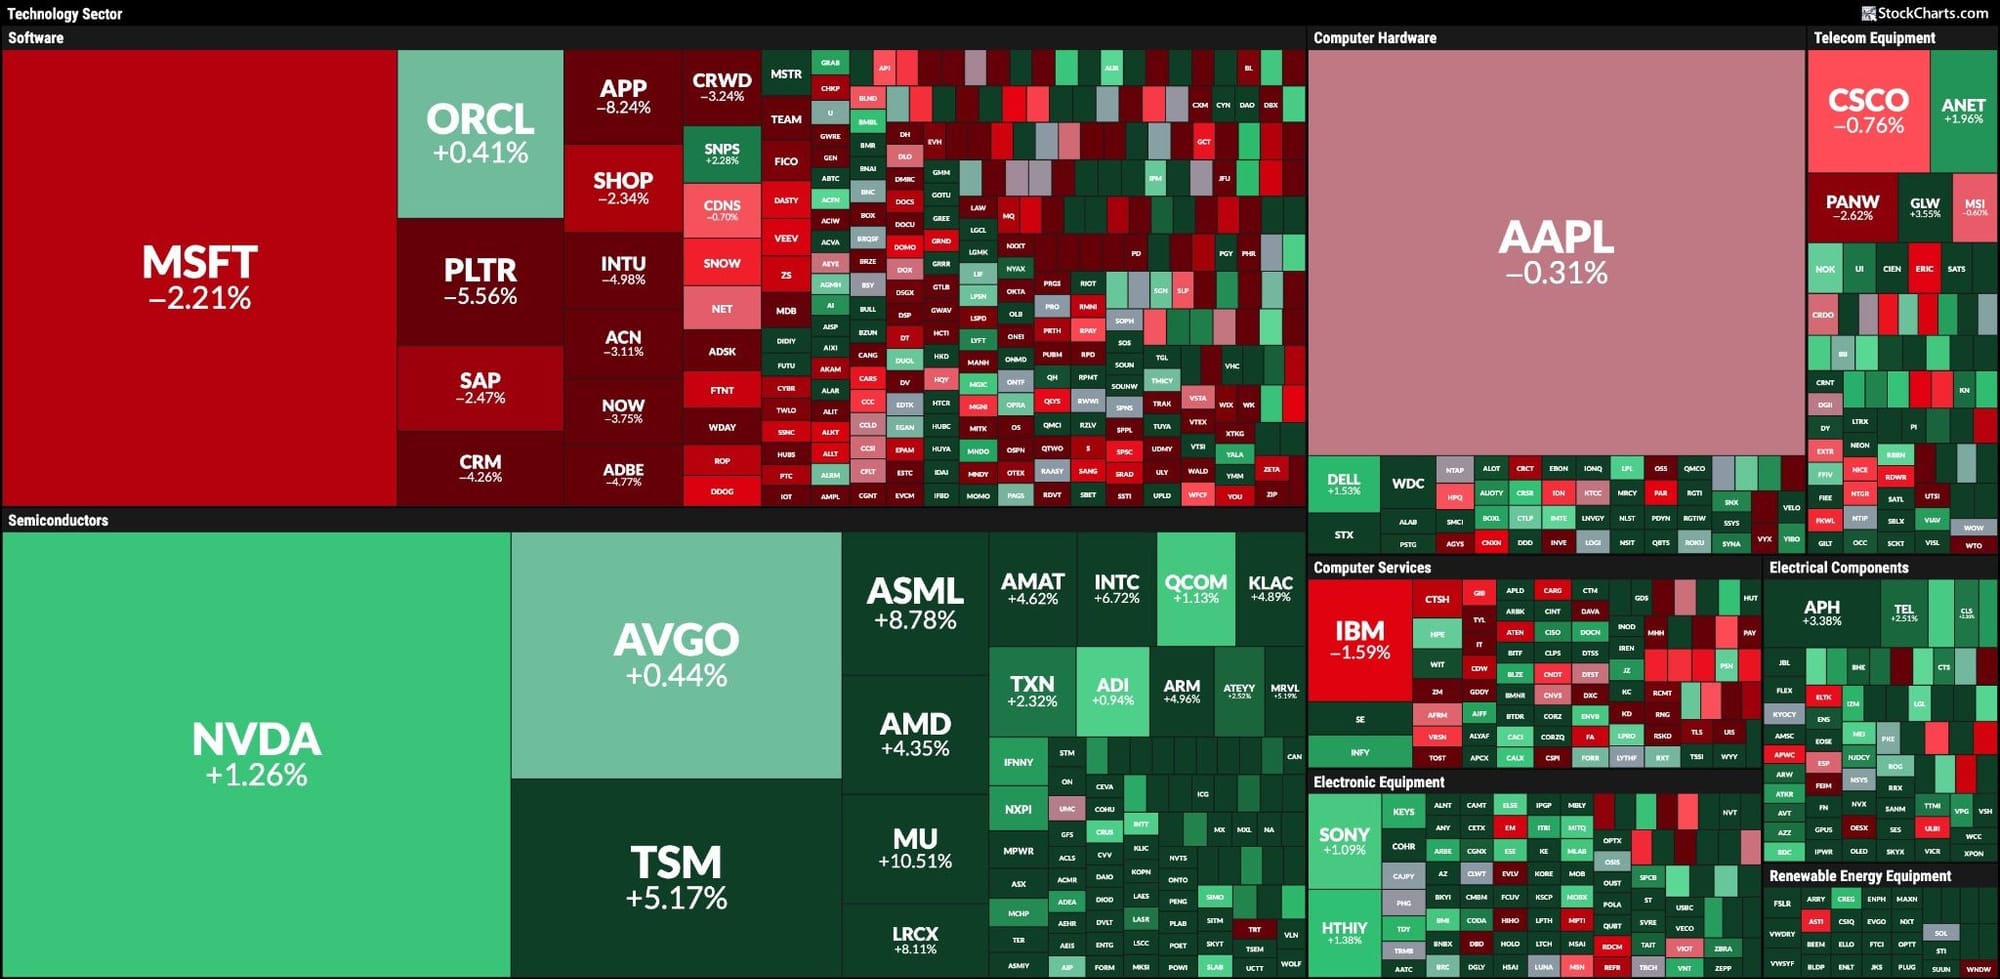
Big winners include Micron Technology (MU), Intel Corp. (INTC), and ASML (ASML).
Banks Had a Solid Day Too
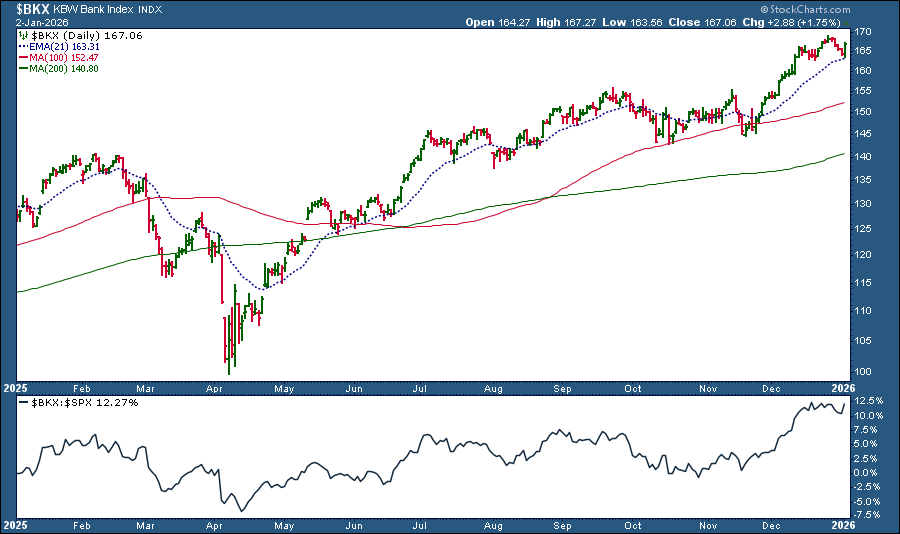
Big banks also joined the rally. The one-year chart of the KBW Bank Index ($BKX) shows the index bouncing off its 21-day EMA with improving relative strength against the S&P 500.
Big Picture: A Mixed Day but a Better Tone
Overall, it was a mixed day in the market. Precious metals are taking a breather after their relentless rally, Treasury yields rose, and Bitcoin showed some strength by the close on Friday.
Next week will be the first full week of trading in the new year. We will get a handful of key economic data, including the December Non-Farm Payrolls. Will it be enough to keep the market moving higher and possibly give us a Santa Claus Rally and a positive first five days of January?
That’s what we’ll be watching.
Disclaimer: This blog is for educational purposes only and should not be construed as financial advice. The ideas and strategies should never be used without first assessing your own personal and financial situation, or without consulting a financial professional.


