StockCharts Insider: A Renko Technique to Fine-Tune Your Dollar-Cost Averaging
Who This Article is For: This article is for the long-term investor who isn’t a full-on expert chartist but wants to know enough to use it to fine-tune their dollar cost averaging strategy. If this is you, read on.
Before We Dive In…
Not every long-term investor wants to be a chart expert. That’s not their game (at least for now). Most buy and hold stocks, sometimes for years, but still face the same question: Is now a reasonable time to buy or add? Many of these investors tune into financial media. But pundits typically offer plenty of opinions, but with very little clarity. The result? Investors remain uncertain and often get frustrated.
While there are different solutions to this problem, the one we’ll look at today is offered by Renko charts. These charts filter out much of the day-to-day noise and focus only on meaningful price movement. These charts can help you understand where price sits within the broader trend without turning investing into a chart-reading exercise or, even worse, relying on the latest TV narrative.
The Problem with Financial Media Investing Recommendations
Here’s a collection of real quotes from financial experts, most of it taken from TV (I’ve removed actual stock tickers):
- “You just buy the stock of XYZ.”
- “I think that this stock is a buy right now.”
- “This is a buy.”
- “I would be a buyer of XYZ at current levels.”
- “Now’s the time to buy into the stock market rebound.”
You see the problem here, right? There’s no context.
So what do you do—log into your stock account, see where the stock is trading, and pull the trigger? Sure, you’re a “buy only” type of investor, but how do you know that you really want to buy now? What if price is in the midst of a decline—maybe you’d rather wait for an upturn?
At the very least, wouldn’t you want to know where the stock sits with regard to the trend?
Renko Charts in a Nutshell
Renko charts come from Japan and trace their roots back to rice traders in the 17th century, who cared far more about meaningful price movement than what happened at 10:17 a.m. on any given day.
Essentially, where most price charts ask “What did price do today?”, Renko instead asks, “Did price move enough to change the big picture?”
Rather than plotting price against time, Renko charts build bricks. A new brick only appears when price moves by a preset amount—say $5, $10, or one based on Average True Range (ATR). If price doesn’t move that much, nothing happens. No brick, no update. Time doesn’t matter. And that simple filter strips out much of the day-to-day noise, letting you focus on direction rather than headlines or intraday volatility.
Caveat: Brick size is crucial in Renko. StockCharts uses ATR to auto-set it, which keeps the chart in sync with market volatility. Smaller bricks mean more signals; larger bricks mean smoother trends. If you want the deeper mechanics, check out the Renko page in ChartSchool.
Real World Example
Let’s take a look at this piece of advice: “Now’s the time to buy into the stock market rebound,” which you might have heard in early February 2025. Here’s what the market looked like when the opinion was aired.
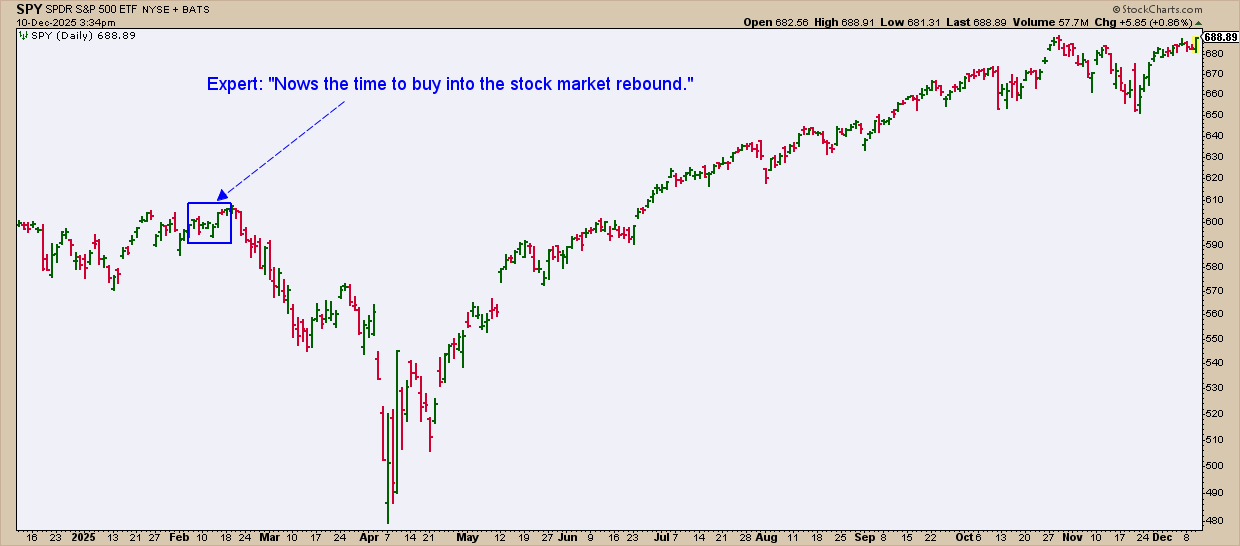
But that’s problematic. Buy where, when, and under what conditions? Does “rebound” mean the market is going up from here on, or could there be further downside (as is what ultimately happened)?
As a long-term investor, you’re probably not ultra-keen on timing the market. But if better timing presented itself, you wouldn’t dismiss that either.
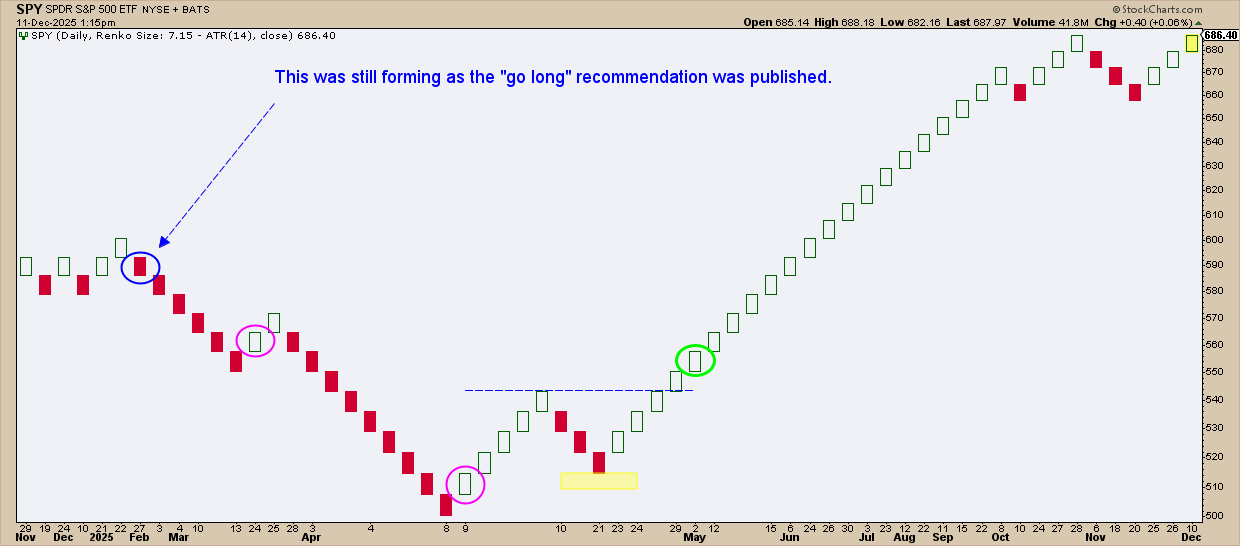
If you looked at a Renko chart, this is what you would have seen.
There are many long-investors who “dollar cost average” when it comes to SPY. While not going against that principle, I’m simply laying out a way to fine-tune that approach.
Let’s assume that an investor uses a Renko chart to help with buying decisions.
- Many might not have bought SPY on a down brick (see blue circle), waiting for at least one bullish reversal brick . That’s the most common Renko rule.
- Some might have bought on an upturn (see magenta circles) regardless of whether or not the downtrend reversed—a more fine-tuned approach to dollar cost averaging.
- The three bearish bricks at the end of April made a higher low (see yellow-shaded area) signaling a potential trend reversal. Swing highs and lows on Renko carry extra weight because each swing is more likely to represent real directional commitment, and not a single day's noise.
- In May, price broke above the last significant swing high (see dotted blue line), further confirming the likelihood of an uptrend. An investor might have entered another position following the breakout (see green circle).
A Few Insider Tips to Consider
Insider Tip #1: The absence of bricks is information. When no bricks are forming for a long time, say, several sessions in a row, it often means there’s no conviction in the market. This happens during congestion periods as well as before a major reversal or breakout. So sit tight.
Insider Tip #2: Renko lags on purpose (an important feature). Moving averages lag because they update every time period. Not all of those updates are meaningful. By contrast, Renko only updates when a meaningful price move happens.
Renko can update a few times a day, or it can wait a few days, weeks, or months to form a new brick. This is not just time lag, it’s “confirmation lag,” which is what makes Renko bricks a bit more certain and reliable, especially for long-term investors.
And That’s a Wrap
Renko won’t replace your long-term investment plan or disrupt your dollar-cost averaging strategy, but it can help you with timing. By filtering out day-to-day noise, highlighting genuine trend movement, and requiring price to “prove” itself before updating, Renko offers a clearer perspective on market direction and potential entry points. And while Renko necessarily lags, this “confirmation lag” is a feature, one that removes unnecessary complexity and helps you focus on the moves that really matter. Give it a try on a few stocks you follow; if it adds clarity to your dollar-cost averaging approach, you’ve gained another effective tool in your toolbox.


