StockCharts Insider: A Simple Tool to Elevate Your Silver Game
Before We Dive In…
Silver’s been making headlines lately, testing historic highs, and stealing a bit of gold’s shine. Might you have forecasted its rise? Some “old school” silver and gold bugs claim it is possible, using this one metric. Let’s explore what it is and unpack it.
Beyond the Goldbug Chatter
Hang around goldbugs long enough and you’ll hear plenty about four things: Fed follies (monetary policy), fiscal misadventures, general economics, and geopolitics. A critical thing typically missing from many of these conversations, however, is any topic that’s TA-centric.
Sometimes, now and then, technicals do come up. And when TA is in focus, there’s one metric that gets plenty of airtime: the gold–silver ratio (aka, GSR).
What’s the GSR and Why Do Silver Folks Care?
The Gold–Silver Ratio (GSR) is gold’s price divided by silver’s price. It tells you how many ounces of silver are needed to equal one ounce of gold.
Silver bulls love to cite 16:1 as a “natural” anchor. But why is that? Essentially, it comes from geologic estimates that there’s a crustal abundance of 16:1, meaning there’s 16 times more silver than gold in the earth’s crust.
Yet history’s estimates are all over the map: ancient Greeks and Romans fixed the ratio around 12:1. In the 19th century, it was fixed to 15–16:1. In 1980, the GSR briefly collapsed to 17 from around 45, and, in 2020, the ratio hit above 120 (probably the highest ratio reading ever recorded). Over the last few decades, the GSR has been hanging around the 50–70 zone.
How Do You Read the GSR?
Okay, so what does this all mean? It roughly means this:
- High GSR = gold leading and silver lagging (some read silver as undervalued).
- Low GSR = silver leading and gold lagging (some read gold as undervalued).
Insider Tip: To create your own GSR, just copy and paste this ticker into your chart: $GOLD:$SILVER. That’s all you need to do.
But here’s the catch: there’s no magic line for “too high” or “too low,” and extremes can stay extreme. Use the GSR for context, not as a trading signal.
The GSR in Action - A Hypothetical Lookback
Check out the following chart. The shaded circles are hypothetical trades. Without the GSR, these are what the entry points look like. Some entry points were obvious while others were not.
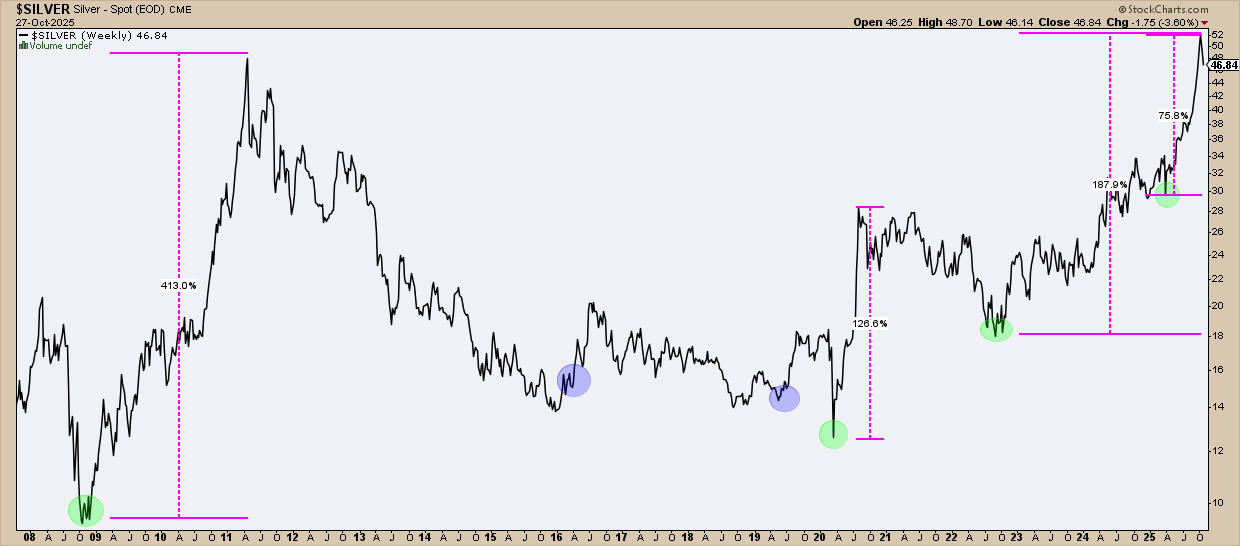
Traders who carefully used GSR with their trading strategy, then, in the best-case scenario, they might have achieved a return as high as the following (or something close to it):
- 413% profit in the first trade.
- A breakeven result in the second and third trades (see blue dots).
- 188% profit in the fourth trade.
- 76% gain in the last trade.
So, how might they have chosen those specific points of entry? Here’s the full picture:
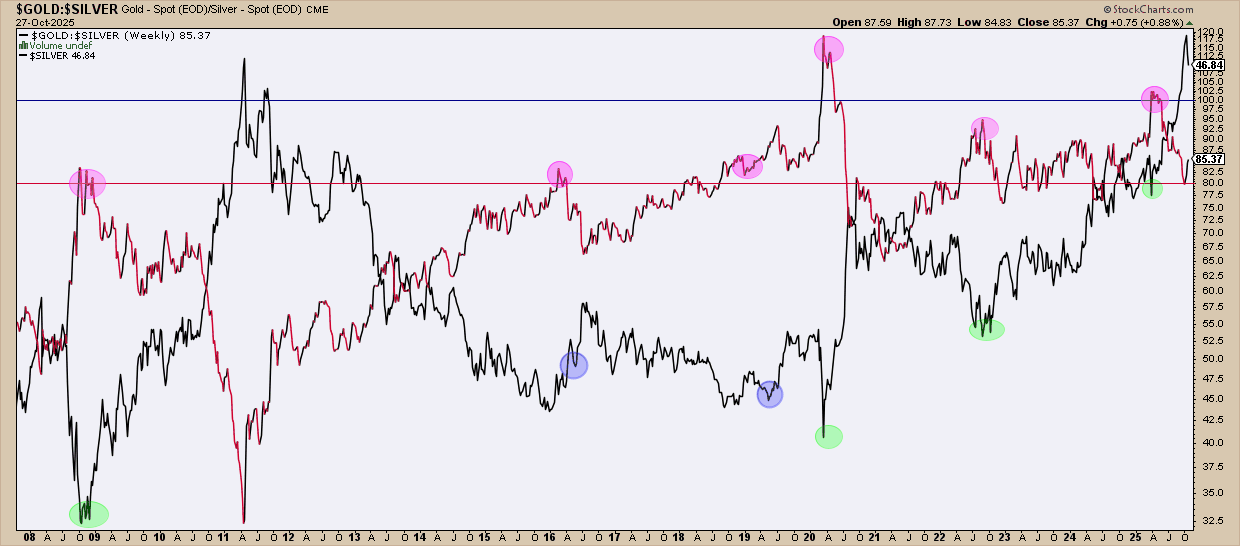
As you can see, GSR readings above 80 were considered high, and they coincided with silver lows. The lows were relative, and you would have had to look at the specific price action if you were to have gone long.
April 2025 - GSR Exceeded 100
Let’s take a closer look at the last trade on the chart.
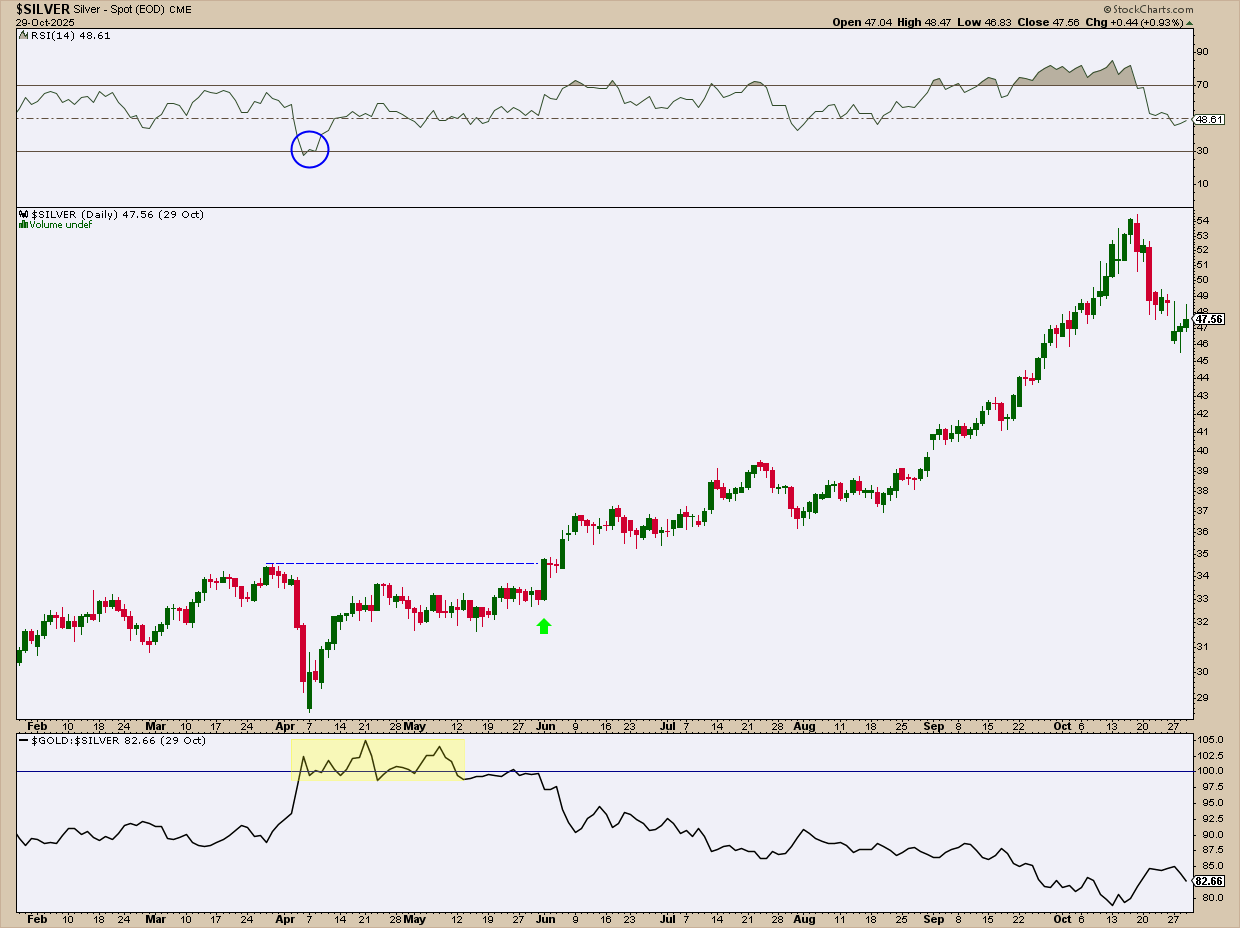
Here’s the situation: The GSR exceeded 100, coinciding with an “oversold” reading in the RSI. As I mentioned in a previous article, the RSI can sustain extreme levels for a prolonged period of time. So, what you might have done was to wait for an upside breakout (see blue dotted line and green arrow) to get into the trade.
The main point: Use the GSR like you would a macro compass, but check the price action to get your bearings and to build your setup.
And That’s a Wrap
Silver’s recent rally has everyone talking, but context is everything. The GSR won’t hand you perfect entries, yet it will alert you long before silver fever kicks in. When the ratio shoots north of 100, get ready, but don’t act on the number alone. Check the price action and pair it with other indicators. Remember, when fundamentals get fuzzy, the GSR can give you clarity—and maybe even a second opinion.


