StockCharts Insider: GMMA—Your Market X-Ray
Before We Dive In…
You’re about to learn something unique: how to gauge trend strength and seize market opportunities using two sets of eyes. The GMMA splits price action into short-term and long-term views, giving you two perspectives on the same market. With one eye on fast-money moves and the other on slower, steadier flows, you’ll see who’s pushing the trend, who’s hesitating, and when pressure is building for a potential breakout.
The Noisy, Drunken Walk of Price
Stock prices never move in straight lines. They climb, dip, stall, and sometimes fake you out. That makes it tough to tell if a pullback is a mere pause or the start of a bigger trend reversal.
So, we use indicators.
Indicators help you gauge trend strength and various other things to get a better read on the market. But here’s a twist: given that traders and investors drive the market, what if you could peek at what each is doing, side by side? This is where the Guppy Multiple Moving Average (GMMA) can help.
Tracking Short-Term (Fast) and Long-Term (Slow) Money
The GMMA doesn’t “know” exactly what each crowd is doing, but it’s an effective proxy to track their movements. By layering two groups of moving averages, it gives you a window into how traders and investors may be leaning—whether piling in, sitting tight, or heading for the exits.
If you’ve never seen this before and are having a hard time imagining it, here’s what it looks like:
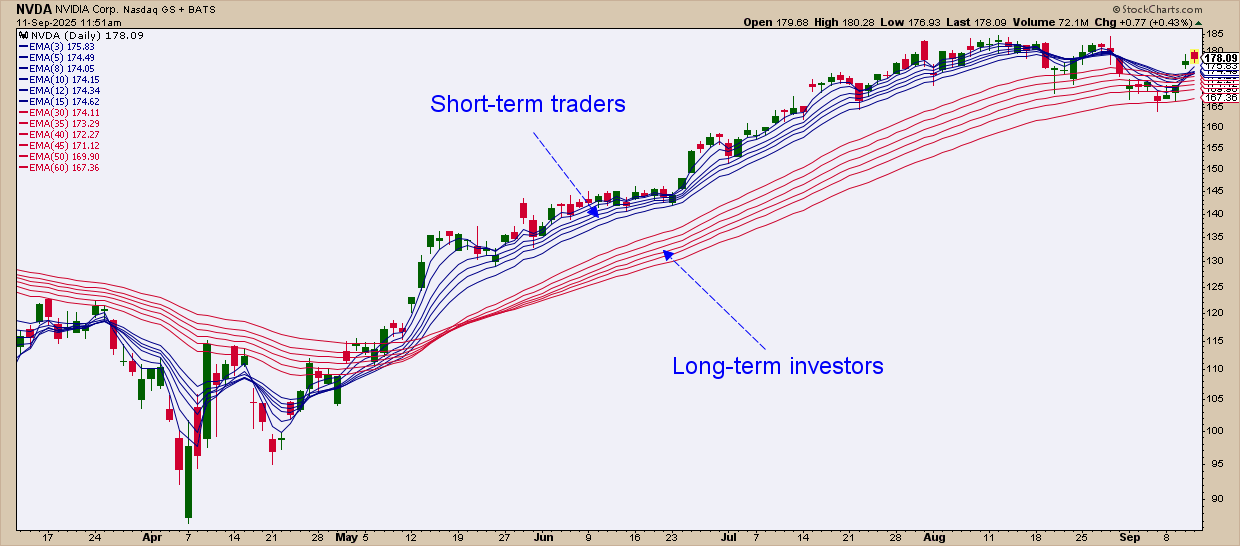
Now that you’ve seen the ribbons in action, let’s break down what they’re really saying about the market.
So, What Does the GMMA Tell You?
Think of the GMMA as something of a trend decoder. It boils the price action down to three things:
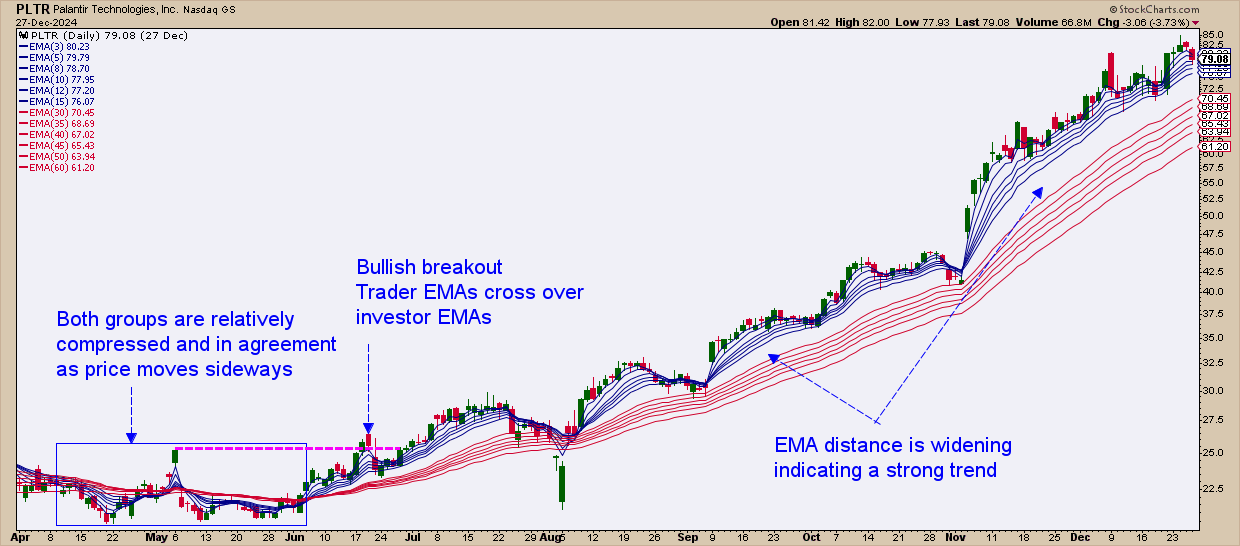
- Trend direction and strength: The wider the gap between short-term traders and long-term investors, the stronger the trend. If the gap is tightening and starting to converge, it means the trend is weakening.
- Conditions before a reversal: A simple pullback or a likely trend reversal? When the trader and investor EMAs are bunched together (aka “compressed”), it’s a red flag that a reversal may be brewing.
- Agreement vs disagreement: When both EMA packs move sideways together, it signals agreement—whether in conviction or hesitation. Either way, the market is coiled for a shift.
So, How Do You Build It?
It’s pretty easy. You’ll need a “ribbon” of 12 EMAs separated into two packs:
- Short-term EMAs (traders): 3, 5, 8, 10, 12, 15
- Long-term EMAs (investors): 30, 35, 40, 45, 50, 60
You can always check out my GMMA setup on SharpCharts.
So, How Do I Use It?
Think of the GMMA as your all-purpose trend decoder. Here are a few common ways traders and investors put it to work:
1 - Trendspotting
A basic way to use the GMMA: Figure out if a market is trending or chopping sideways.
2 - Compression = coiled spring
When both packs squeeze tight, a breakout’s coming. Confirm it with price and volume. Bonus Insider Tip: If both packs flatten and volatility dries up, the stock may be building pressure for an explosive move. Pair GMMA with a volatility gauge to help catch the breakout.
3 - Time your entries
In an uptrend, buy the dip when price bounces off a rising (and strong) investor pack. In a downtrend, sell the rally when the trader pack can’t punch through a descending investor pack.
4 - Watch the crossovers
If the trader pack slices above the investor pack, it’s an early hint the tide may be turning bullish (and vice versa for bearish). Always zoom out before acting to check the bigger picture.
5 - Who’s driving the market?
If the short pack moves first, traders are in control. If the long pack angles and spreads, investors are piling in too.
6 - Any timeframe
Try using the GMMA intraday, daily, and weekly. It’s a flexible tool. On shorter timeframes, think of it as fast-money vs. slower-money flows, rather than traders vs. investors.
Like Every Indicator, the GMMA Has Its Limitations
If you’re going to use the GMMA, be aware of its limitations. Here are three of the main ones to keep in mind:
- It lags by design: The GMMA is built on moving averages, so it will always react after the fact.
- It’s not a magic trigger: Don’t look at crossovers and compressions as immediate buy and sell signals. Treat them as setups that need confirmation.
- Pair it up with other indicators: Try combining the GMMA with other trend, volume, breadth, and momentum tools, plus key support and resistance levels to filter out the noise.
- Be careful around choppy markets: Crossovers can throw false signals, but GMMA makes the “chop” visible, giving you context to plan your next move.
Think of GMMA as a framework, not a verdict. Let it narrow your aim, but allow your other complementary tools and strategies to decide when to pull the trigger.
And That’s a Wrap
The GMMA isn’t about calling tops or bottoms or triggering buy and sell signals. It’s about giving you a framework that you can quickly turn into a setup. With it, you have strong tools to identify and gauge trends. It makes momentum visible in ways most indicators can’t.
Bottom line: GMMA is a flexible, multi-timeframe way to track crowd behavior. It’s a map of sentiment-turned-action from the perspective of traders vs. investors, or fast money vs. slow money.


