StockCharts Insider: How an “Overbought” RSI Can Be Your Best Buy Signal
Before We Dive In…
Think “overbought” means it’s time to bail? Not always. Sometimes that 70+ RSI reading doesn’t signal weakness, but strength. In this Insider post, we’ll flip the script on RSI, show you why overbought often means “stay on board,” and give you the tools and scans to spot those hidden signals like a pro.
What Traders Often Get Wrong
Many traders mistakenly assume that a Relative Strength Index (RSI) reading above 70 signals a potential pullback. They look for sell signals when, in some cases, an overbought reading is an invitation to buy into strength.
Don’t make this mistake.
Just look at any chart exhibiting a strong uptrend and you’ll see what I mean. Overbought RSI readings, especially when they first take place, are often followed by even more overbought readings. Notice how the upward swings are often quite dramatic.
What does this tell you? It says that under the right conditions, an RSI reading over 70 can be one of the strongest buy signals you’ll get. It indicates “strength,” not “surrender.”
Quick Refresher: What is RSI?
The Relative Strength Index (RSI) is a momentum oscillator that swings between 0 and 100. Traditionally, readings above 70 are considered overbought, while readings below 30 are “oversold.”
Of course, it’s more nuanced than this. Missing the nuances is where many traders, especially new ones, go astray. So, understanding those nuances—particularly when the crowd misreads them—is a “legit” advantage that you can exploit.
Welles Wilder, who created RSI in 1978, intended it to spot extremes in sideways markets. But there’s an obvious twist (or trap): in trending markets, those rules of thumb don’t always hold up.
Why “Overbought” Isn’t Always Bearish
I mentioned “trap.” Well, here it is: most traders see RSI >70 and think the trend is toast. They confuse strength with exhaustion. But in a strong uptrend, strength often breeds more strength.
Yes, you may get short-term dips after an overbought reading. But those usually signal buying opportunities. You see, stocks can hang out near or above 70 for weeks, even months, while prices keep grinding higher. In this case, RSI above 70 is not a red flag, but a green light for momentum.
To give you an example of what that looks like:

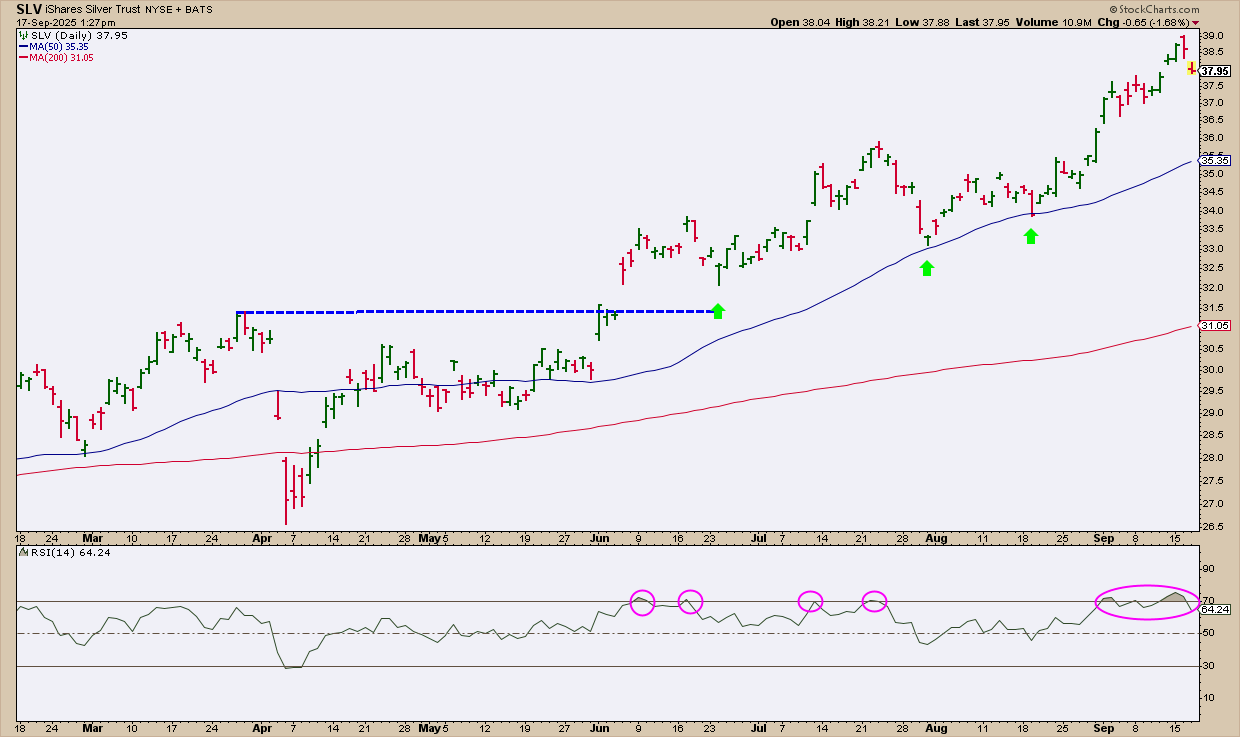
Take iShares Silver Trust (SLV). After breaking out of resistance in June (see blue dotted line), the RSI kept punching above the 70 line while price steadily climbed. Each dip under 70 was met with support (see green arrows). By July and August, even as RSI cooled near 50, price respected its 50-day simple moving average (SMA) and kept the rally going.
In this case, RSI >70 signaled not weakness, but successive bursts of bullish momentum. The bottom line is this: RSI >70 doesn’t always signal weakness. It can point straight to tradable momentum, as long as price stays above key support levels.
A Bullish Twist: RSI as a Strength Filter
In an uptrend, the RSI’s bullish range is roughly between 40 and 90. So, what does this mean? Here’s a simple rule of thumb to keep in mind (and you have to be flexible with this depending on the scenario):
- Pullbacks toward 40–50 = support zones.
- Breaks above 70 = momentum confirmation.
Instead of getting worried when RSI hits 70+, use it to find the strongest momentum runners.
How Do You Spot Strong Buys with RSI Over 70?
There are two main ways.
Manual method:
- Start with a trend filter, like a 200-day SMA. Price should be above it.
- Use RSI crossing above 70 as your momentum filter.
- Confirm with price making new highs or breaking resistance.
Scan method:
Here’s your Insider Bonus: check out the Overbought with a Declining RSI scan in the Sample Scan Library. It’s technically a bearish scan, but you can flip it—look for cases where “overbought” may actually be strength in disguise. This lets you cast a wide net for RSI >70 candidates across the StockCharts universe.
Just remember: the scan will surface both bearish and bullish cases, so you’ll need to separate the true warnings from the hidden opportunities.
Keep the Caveats in Mind
RSI >70 only flashes strength in an uptrend. If price is just chopping sideways, the old rules apply—30 can still mean “buy” and 70 can still mean “sell.” Even in uptrends, extended RSI readings can lead to consolidations, so keep an eye on support and resistance.
Thinking about a buy? Layer in confirmation by adding moving averages, trendlines, and support zones to your setup. These can help stack the odds in your favor.
Insider Tip #1 - Look for Clusters
Secret angle: multiple overbought readings clustered together sequentially in an uptrend often signals strength, not weakness.

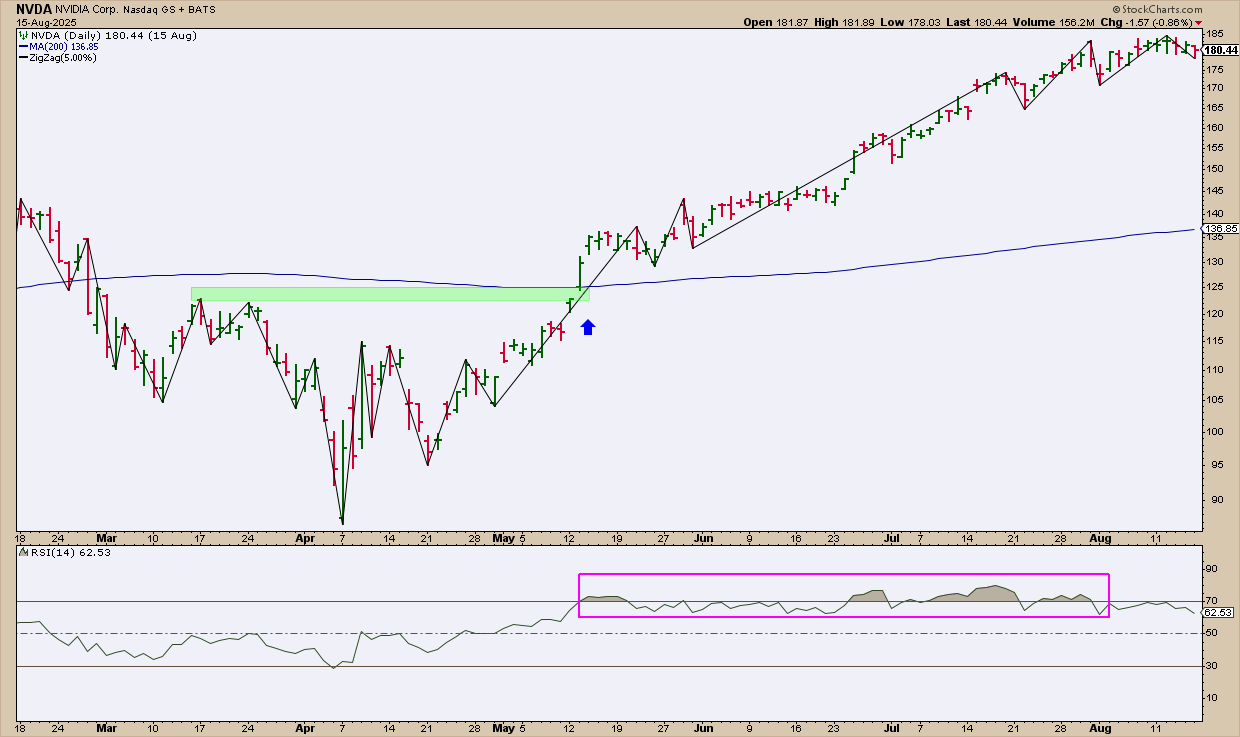
In the NVIDIA Corp. (NVDA) example above, price cleared resistance and the 200-day SMA (green zone) just as RSI popped into overbought. What happened next? A cluster of overbought readings that pushed RSI even higher before it finally cooled off.
The ZigZag confirms the story: price kept printing higher highs and higher lows. Translation? Those RSI clusters weren’t warning signs of a weakening rally. They were bullish momentum signals.
Insider Tip #2 - Watch for Consolidations Above the RSI 50-Line
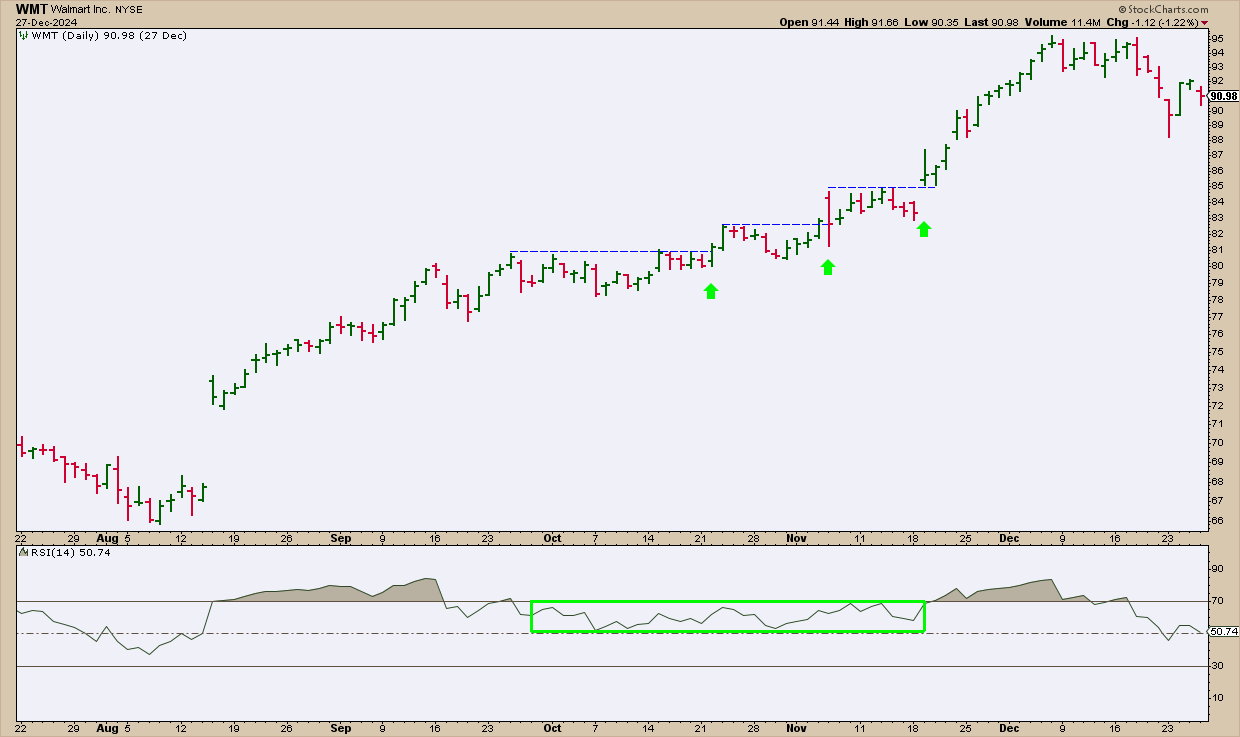
If prices begin consolidating as the RSI drops from above 70, but do so without dropping below 50, that’s a bullish setup.

See the green arrows? Those breakouts would have served as strong entry points as the RSI fluctuated above 50 but below 70. Three bullish setups that led to a strong finish.
Now, step back and put the two tips together, and you’ve got a roadmap: clusters show you momentum in motion, while consolidations above 50 tell you that strength is just pausing. In other words, RSI can hint at where the potential leaders are.
And That’s a Wrap
So, here’s the punchline: an “overbought” reading doesn’t have to scare you out of a trade. When RSI clusters above 70, that’s strength talking. When it cools off but holds above 50, that’s momentum catching its breath. If price holds key support, the trend’s still valid.
Stack those RSI signals with trend filters and support checks, and you’ve got an edge most traders miss. So next time RSI looks “too high,” flip the script, because sometimes the strongest buys hide behind the red flags.


