StockCharts Insider: How to Find a Seasonal Edge in Stocks by Cracking the Market’s Hidden Calendar
Before We Dive In…
For every story a chart tells, there are stories hidden from plain view. One story tends to repeat itself almost like clockwork, though it also comes with variations. That’s what seasonality is all about: odd months where stocks tend to shine, stumble, or stall. In today’s Insider article, we’ll crack open the hidden calendar behind the market, show you how to spot the bias, and most importantly, how to use it without falling for false signals.
The Market’s Hidden Clock
Every stock has unique characteristics, and some go beyond common metrics. One such “strange” characteristic is how price patterns tend to repeat over the calendar year with no clear driver. For example, Apple (AAPL) tends to gain the most in July. Bank of America (BAC), on the other hand, tends to have its worst stumble in March. Why?
One explanation is seasonality. It’s like a hidden clock that stocks, sectors, and markets tend to follow, more often than not. Just look at any Seasonality Chart and you’ll see what I’m referring to. These patterns can go back years, even decades.
Here’s how you can use it to your advantage: Seasonality charts give you the historical odds—but not the guarantee—of market moves.
Of course, the trick isn’t to worship the clock, but to know when the hands line up in your favor. If you think about it, that’s an exploitable edge, especially if you were to use it to anticipate and, eventually, capture a meaningful market move. Before we get into it, though, let’s first go over a few basics.
What is Market Seasonality?
Markets, especially commodities, have their own rhythms throughout the calendar year. Corn prices swing during harvest season. Gasoline prices pop during the summer. It’s all about supply and demand.
You can probably understand how it all makes sense for commodity production cycles. But how does that apply to individual stocks?
How Can Individual Stocks Have Seasonality?
Similar to commodities, stocks have internal and external cycles.
- Earnings season puts companies on stage every three months. Sometimes you get fireworks; other times, you just get a fire, or even a fire sale.
- Industry cycles, like the holidays or summer, create waves of demand for certain products.
- Investor habits, such as tax-loss harvesting in December, add another layer of consistency to price rhythms.
- Company playbooks also matter. For instance, Apple’s September product launches have become a ritual in the tech industry these days. Stocks react to these events and strategies.
Put it all together and you get seasonality patterns.
So, how can you take advantage of these tendencies? Use StockCharts’ seasonality charts. Here’s what you should look at (we’ll use the AAPL example that I mentioned at the top of the article).
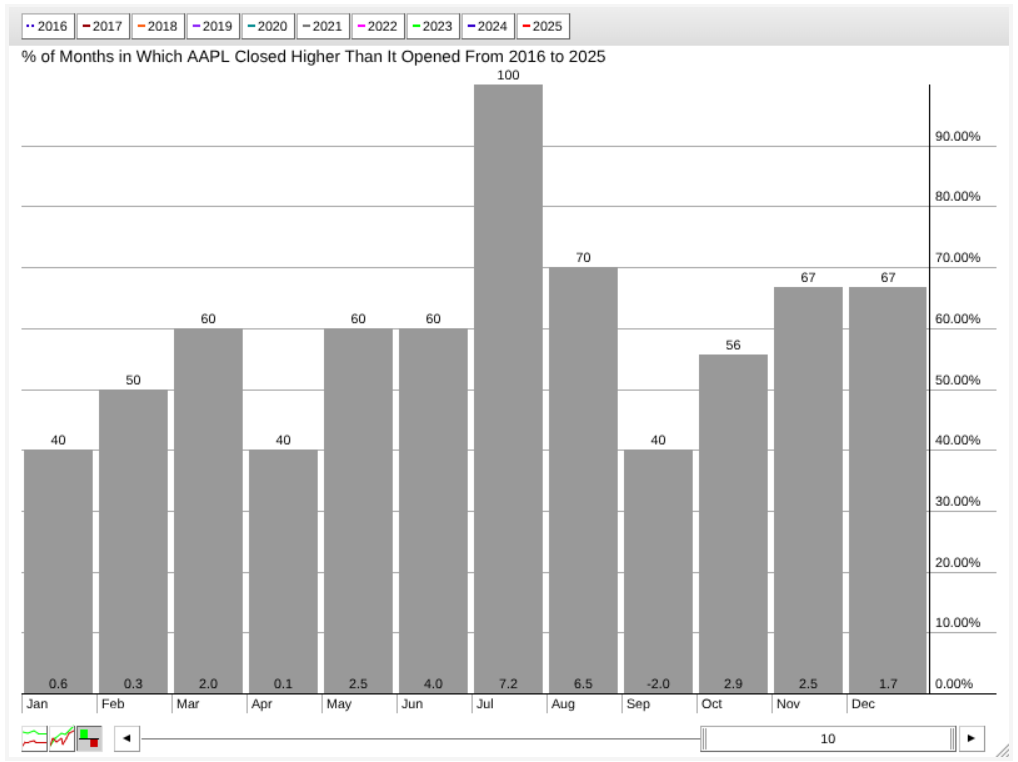
Note: If you haven’t already read the ChartSchool Seasonality Charts tutorial, you should do so. It goes through all the variations and uses of this chart. I’m simply going to cover the main features that I personally use.
Pay attention to these two things:
- Higher close rate: the number (read as percentages) at the top of each bar.
- Average monthly gain or loss: the number at the bottom of each bar.
That’s it. No mysticism. Just math on repeat.
If you look at July on the chart, you’ll notice that over the last 10 years (according to this chart), AAPL has closed higher 100% of the time, with an average return of 7.2%. In the following month, AAPL returned an average of 6.5%, with a higher-close rate of 70%.
So, should you buy AAPL every July and hold it through the end of August?
The answer is “of course not.” BUT… you should anticipate the pattern and confirm with price action to see if there’s a setup for a favorable move. Let’s take a look at what happened in 2025:
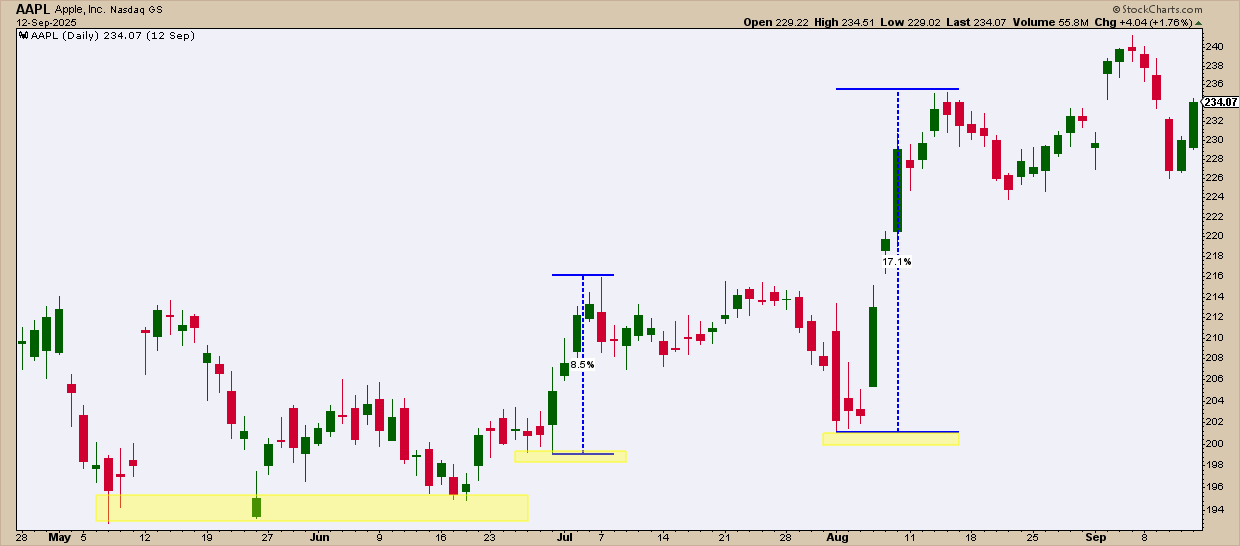
Heading into July, the chart tested the floor three times before carving a higher low in late June (yellow zones = support). July’s rally stretched 8.9% before losing steam—still closing green, but barely. August was the real prize, topping out at +17%.
But here’s the catch: Not every strategy would’ve caught those moves.
Some strategies might have identified clean entries, while others wouldn’t have touched them. That’s the reality of seasonality—it sets the stage, but your method decides the trade. Let’s look at those same months in 2024.
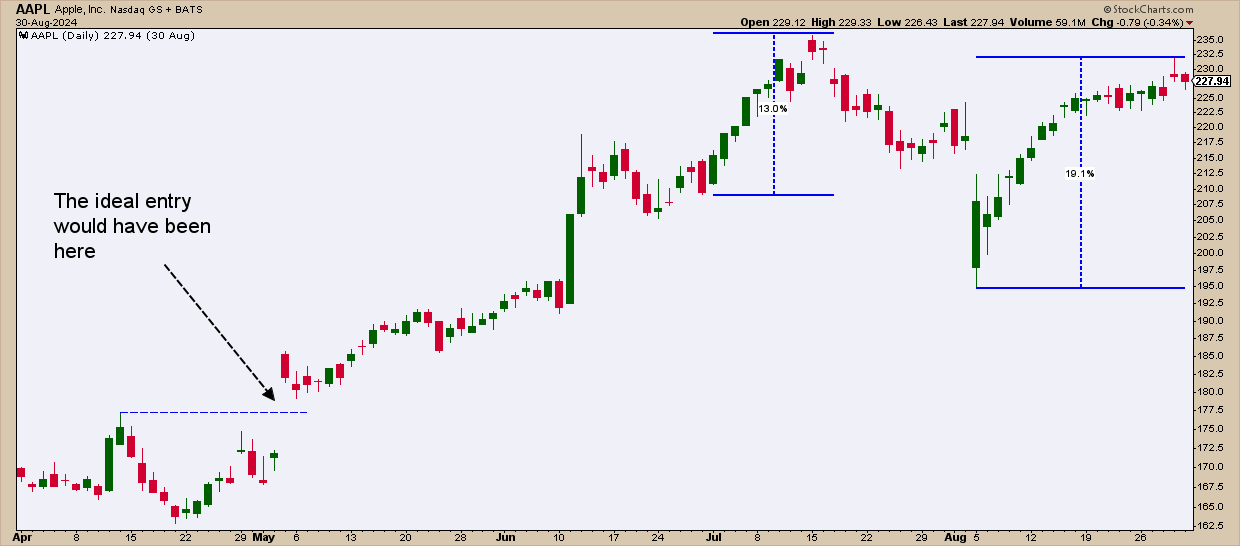
AAPL played the same game. July rallied 13% before fading, barely closing higher. August was the knockout, with +19% after a pullback. But the best entry was back in May, where the seasonality charts showed only a modest 60% win rate and a 2.5% average return.
Hopefully, you get the picture now: seasonality tilts the odds, but the edge comes from pairing it with a sharp and nuanced take on price action.
Insider Tip: Use the Power of Relative Seasonality
Seasonality doesn’t just apply to a single ticker, be it a market or index. It can also tell you how one asset performs against another one on a calendar basis.
Take another large tech giant, Alphabet (GOOGL). It, too, performs well in July, with a 90% higher-close rate and a 7.1% average return over the last ten years.
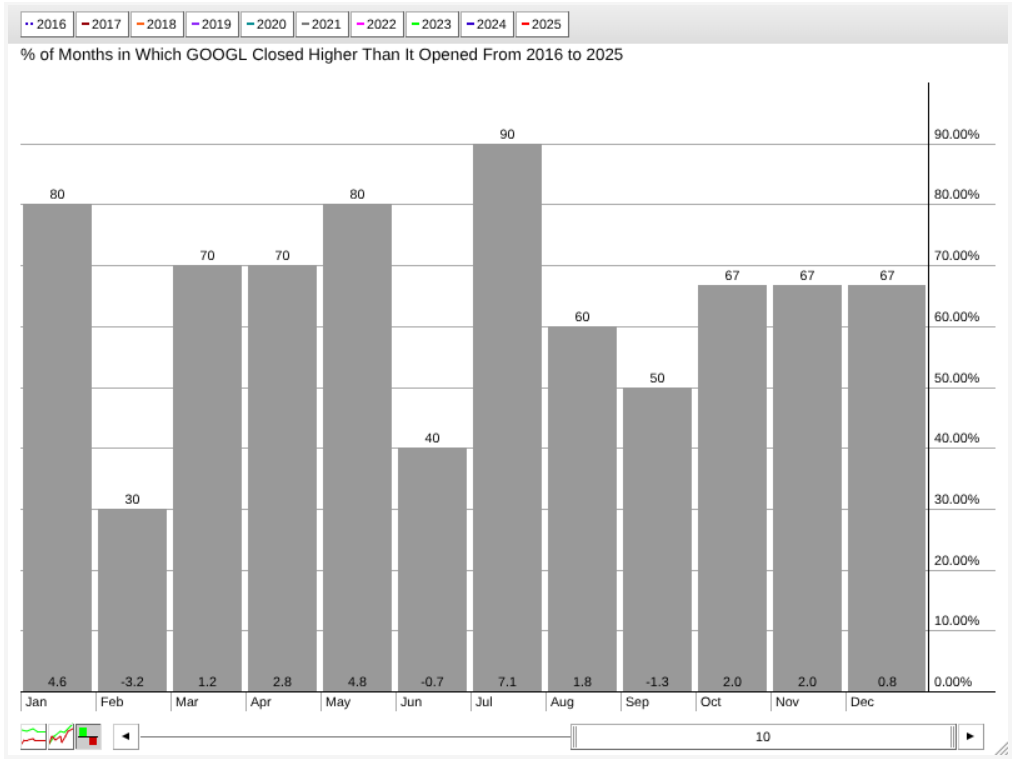
What if you were deciding between AAPL and GOOGL? Both have impressive higher-close rates in July and their average returns are above 7%. However, when you pit them against one another, their relative seasonality gives you a much different picture.
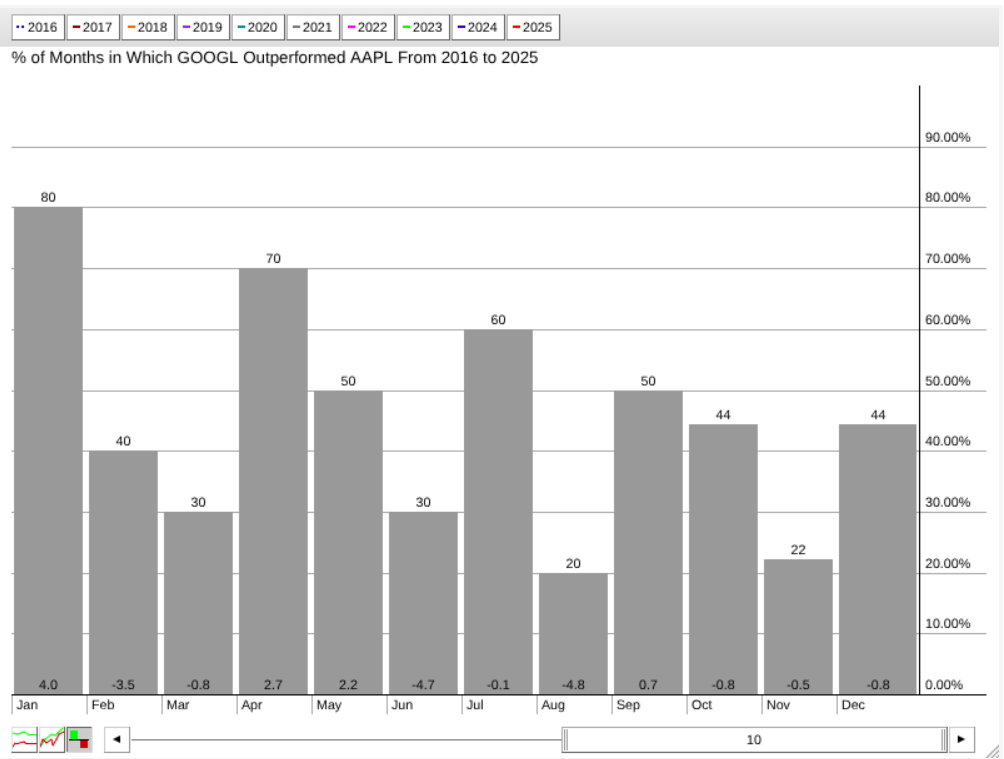
But here’s where relative seasonality changes the story. When you stack GOOGL directly against AAPL, the advantage shifts. In July, GOOGL’s relative return averages just +0.1%, following a -4.7% June and heading into a -4.8% August. In other words, GOOGL may still finish green on its own but, compared to AAPL, its gains are just a fraction of the size.
There are many other applications of relative seasonality but, for now, we’ll stick to the comparative advantage it provides—it’s like an X-ray that exposes hidden seasonal strength you wouldn’t spot otherwise.
Recap - How to Use Seasonality Charts
So, what’s the play with these charts? Think of it as an extra lens, not the whole picture, and certainly not a crystal ball:
- It’s an idea generator: Use it to flag months that deserve a closer look.
- Trend alignment: Strong seasonal bias packs more punch when the current trend is backing it up.
- Context, not compass: Seasonality gives you probabilities, not trade signals.
- Risk awareness: If history says a stock is going to stumble in a given month, it's an early alert to watch it closely and maybe even tighten your stops.
Now, the Caveats
Even the best tools have their blind spots. Seasonality is no exception. If a company’s business shifts, then old seasonality patterns will likely be broken. During broad economic upheavals, a stock’s history will bend to the current stress, rendering old patterns less reliable. The closer the higher-close rate gets to 50%, the closer it gets to a coin flip, so be careful.
And That’s a Wrap
Here’s some parting words of wisdom: Seasonality may set the stage, but the market will always write the script. The edge comes when you line up history’s bias with a sharp take on today’s price action. Experiment with this tool, and perhaps you’ll find a way to make it work for you.


