StockCharts Insider: How to Read Wall Street’s Risk-On Playbook
Before We Dive In…
The Street says it’s risk-on. Sector charts back that up. But, at the time of writing, the stocks that usually lead real bull runs are only doing… okay. So, where’s all the money going? Which corner of risk is capital flowing into? Here’s a suggestion: look at the Key Ratios window on the Market Summary page. Check out US Factors.
Do you see what I’m seeing? It’s showing you the Street’s preferred playbook. Let’s dive in.
Three Dials to Gauge Where the Money is Going
Here’s what I’m referring to.
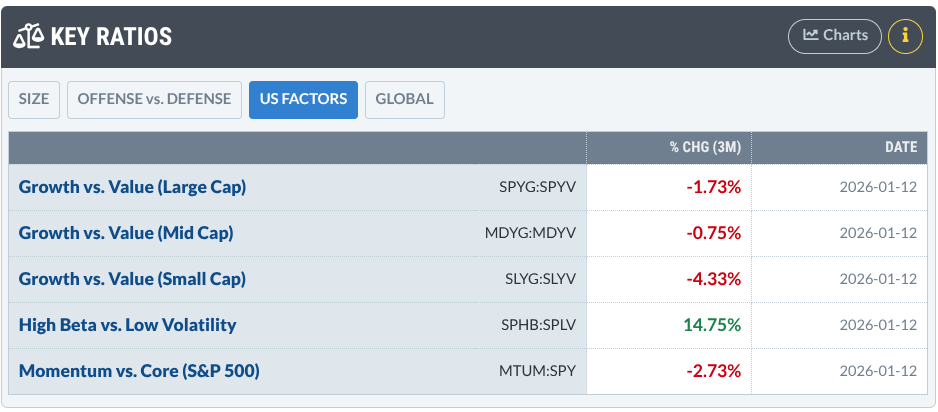
Think of each ratio as a dial:
- Style dial: Growth vs. Value (from Small to Large Cap)
- Risk dial: High Beta vs. Low Vol
- Trend dial: Momentum vs. Core
Different settings = different market personalities. In other words, it’s a fast way to diagnose the quality of risk-taking.
How Do You Read It?
So, what is the US Factors panel in the example above saying?
- Wall Street has been in risk-on mode over the past three months.
- But it’s avoiding the stocks that usually lead strong bull markets—namely, growth and momentum names with big narratives.
- Instead, money is flowing into a narrower group of high-beta stocks, while speculative growth is being benched.
How might you figure this out? Just look at what’s leading: the Invesco S&P 500 High Beta ETF (SPHB).
While its top holdings include high-profile, high-beta names like Micron Technology (MU), Tesla Inc. (TSLA), and Robinhood Markets (HOOD), it also includes companies with less headline presence such as Microchip Technology (MCHP), Albemarle (ALB), and Lam Research (LRCX). In contrast, the large-cap growth index (SPYG) is dominated by the market’s true bellwethers—Nvidia (NVDA), Apple (AAPL), Meta (META), and others.
In case you don’t know what high beta is: Beta measures how volatile a stock or group of stocks is compared to the S&P 500. The index itself has a beta of 1. So a stock with a beta of 2 has historically tended to move about twice as much as the market, rising roughly 10% when the S&P 500 rises 5%, and falling more when it drops.
Okay, that’s the example above. How might you read other possible combinations? While interpreting variations is highly nuanced and can never be 100% certain, there are some common tendencies.
8 Insider Tips for Interpreting the US Factors Ratio Panel
Insider Tip #1 – Spot a True Risk-On Market. When Growth > Value, High Beta > Low Volatility, and Momentum > Core, the market is in classic risk-on mode. Trends tend to persist and speculative leadership is healthy.
Insider Tip #2 – Identify a Defensive Market Early. When Growth < Value, High Beta < Low Volatility, and Momentum < Core, capital preservation is the priority. Expect choppy markets and weaker follow-through.
Insider Tip #3 – Recognize Selective Risk-Taking. When Growth < Value, High Beta > Low Volatility, and Momentum < Core, traders are embracing volatility but avoiding speculative growth. This often leads to rotation instead of durable trends.
Insider Tip #4 – Catch a Fragile Recovery. When Growth > Value, High Beta > Low Volatility, but Momentum < Core, risk appetite may be returning before longer-term confidence does. Breakouts may struggle to hold during this early period of recovery.
Insider Tip #5 – Spot Defensive Growth Leadership. When Growth > Value but High Beta < Low Volatility, investors want growth with lower volatility. Large, profitable tech and quality stocks often dominate. Momentum or core are secondary in this setup; they can be strong or weak.
Insider Tip #6 – Spot a Flow-Driven Market. When Growth ≈ Value, High Beta ≈ Low Volatility, and Momentum > Core, factor flows are doing most of the work. (FYI, ≈ means approximately equal to, or no clear leader.) It’s likely quant-driven, since there are no clear fundamental drivers behind it. Think: mechanical buying pressure. Trends can develop, but leadership remains inconsistent until compelling fundamental narratives emerge.
Insider Tip #7 – Identify Institutional Growth Caution (Less Common). When Growth > Value, High Beta < Low Volatility, and Momentum < Core, large institutions are likely buying growth stocks (driven by fundamentals and narrative) but avoiding high-beta stocks. Speculation is limited and conviction is reasonably low.
Insider Tip #8 – Recognize a Potential Regime Transition. When Growth ≈ Value, High Beta ≈ Low Volatility, and Momentum ≈ Core, the market has no clear preference; no clear leader. You might see this near major turning points or during periods of macro uncertainty.
And That’s a Wrap
Risk-on and risk-off aren’t switches. They’re settings. The US Factors panel helps you see what kind of risk the market is rewarding, whether trends are healthy, and how strong (or fragile) leadership really is.
In short, don’t just trade the headlines. Read the dials first. If the US Factors panel can keep you from trading the wrong playbook for the wrong market, I don’t know about you, but I’d consider that a big win.


