StockCharts Insider: How to Spot a Stock That’s Wound Tight and Ready to Break (Part 2 - TTM Squeeze)
Before We Dive In…
Every strong move begins with tension, a buildup of energy (sometimes hidden) before the next move. While most traders only notice the explosion, those who pay close attention to volatility are generally able to anticipate the big move before it happens. We covered this in part one, where we discussed the Bollinger Band Squeeze. For the second installment, we’re going to cover the TTM Squeeze—another tool to help you spot an asset that’s wound up and ready to move.
TTM Squeeze: A Market Pressure Gauge
The TTM Squeeze, created by trader John Carter of Trade the Markets (now Simpler Trading), is a volatility and momentum indicator designed to detect those low-volatility moments potentially leading to a strong price move.
When you see price consolidating on a chart, think of it as a coiled spring. The tighter the consolidation range, the more potential energy is being stored up. Once that tension breaks, price tends to make a strong and often fast move up or down.
So, how does the TTM Squeeze make that visible? Let’s take a look.
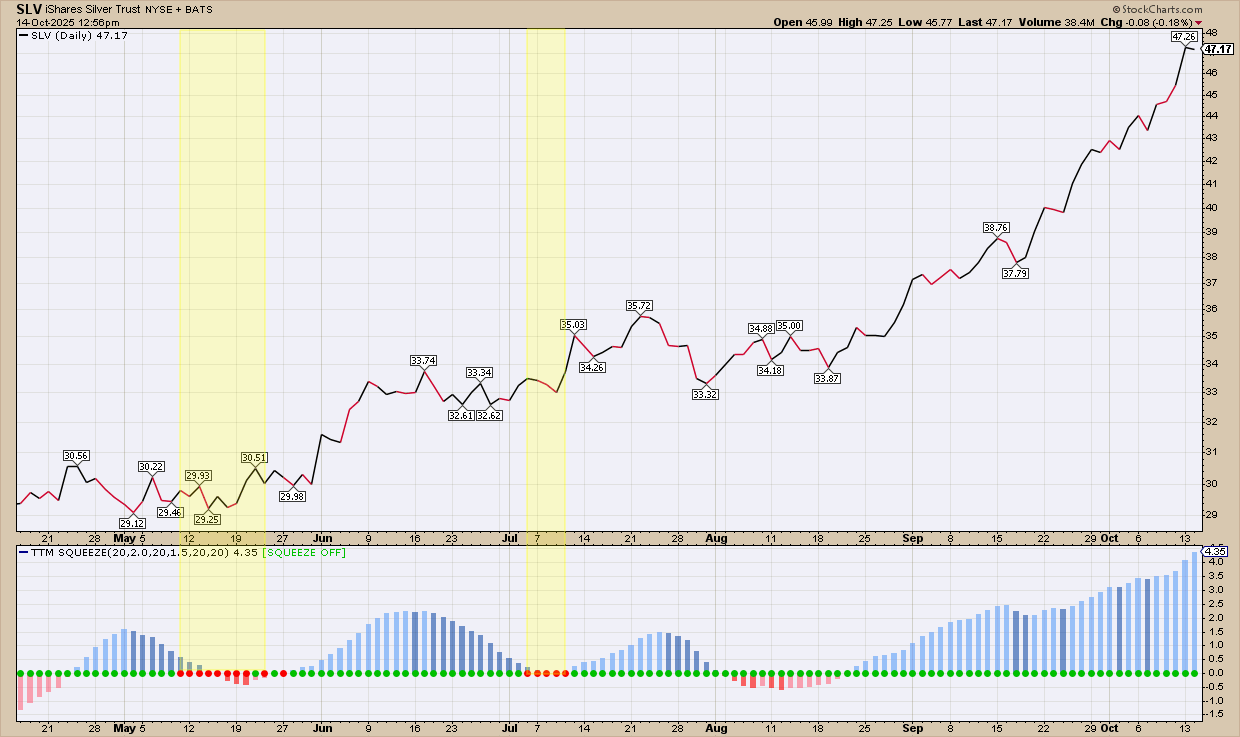
See those red dots along the zero line? That’s the signal that the squeeze is on. Volatility is low, suggesting that $SILVER is loading up with energy. Have you noticed the yellow-shaded zone on the chart? I’m highlighting the squeeze period itself.
Once the dots turn green, the squeeze has fired. The histogram tells you where that energy’s leaning: blue bars above zero hint at bullish momentum, red bars below suggest bearish pressure. As you can see above, momentum is net bullish. Still, that doesn’t mean the price moved in a straight line. There are pullbacks and consolidations through July and August after the second squeeze fired.
That’s where chart reading matters most: watch how price tests structure, forms patterns, and reacts to support or resistance. When silver broke higher again in September, it set up another clear opportunity for bulls to re-enter on strength.
How Does the TTM Squeeze Work?
The TTM Squeeze combines two volatility indicators—Bollinger Bands and Keltner Channels—to spot when “low-key” price action may be winding up for its next big move.
When the calculation detects the Bands contracting inside the Channels, volatility is unusually low, and the TTM Squeeze generates red dots along the zero line. When the Bands expand and push back outside the Channels, volatility increases, the dots turn green, and the squeeze has fired.
In StockCharts, you can see two things displayed by the indicator:
- Dots along the zero line—red for compression, green for expansion.
- A histogram that tracks momentum buildup.
Remember: the squeeze doesn’t predict direction; it tells you when the conditions may be ripe for a breakout. In short, it reveals timing.
Using the Squeeze Like an Insider
Insider Tip #1: Scan for squeezes: Use the Market Movers, New Highs, or SCTR Reports on your Dashboard to find stocks with multiple red dots in a row. Also, check all the stocks in your ChartLists to see if any of them are exhibiting price compression.
Insider Tip #2: Watch support and resistance: John Carter recommends entering a trade on the first green dot after one or more red dots (buying or selling short depends on the movement of the histogram). However, some red dot signals will be stronger than others, and you might consider waiting for confirmation, such as entering a trade after a breakout.
Insider Tip #3: Manage your trade: If you catch a move post-squeeze, be sure to manage your targets and exits. There are many ways to do this in addition to (or instead of) closing a position when the histogram reverses. You might consider using swing points to trail your stop losses to keep your trade in the black.
Now It’s Your Turn
Take a look at the chart below of Oklo Inc. (OKLO).
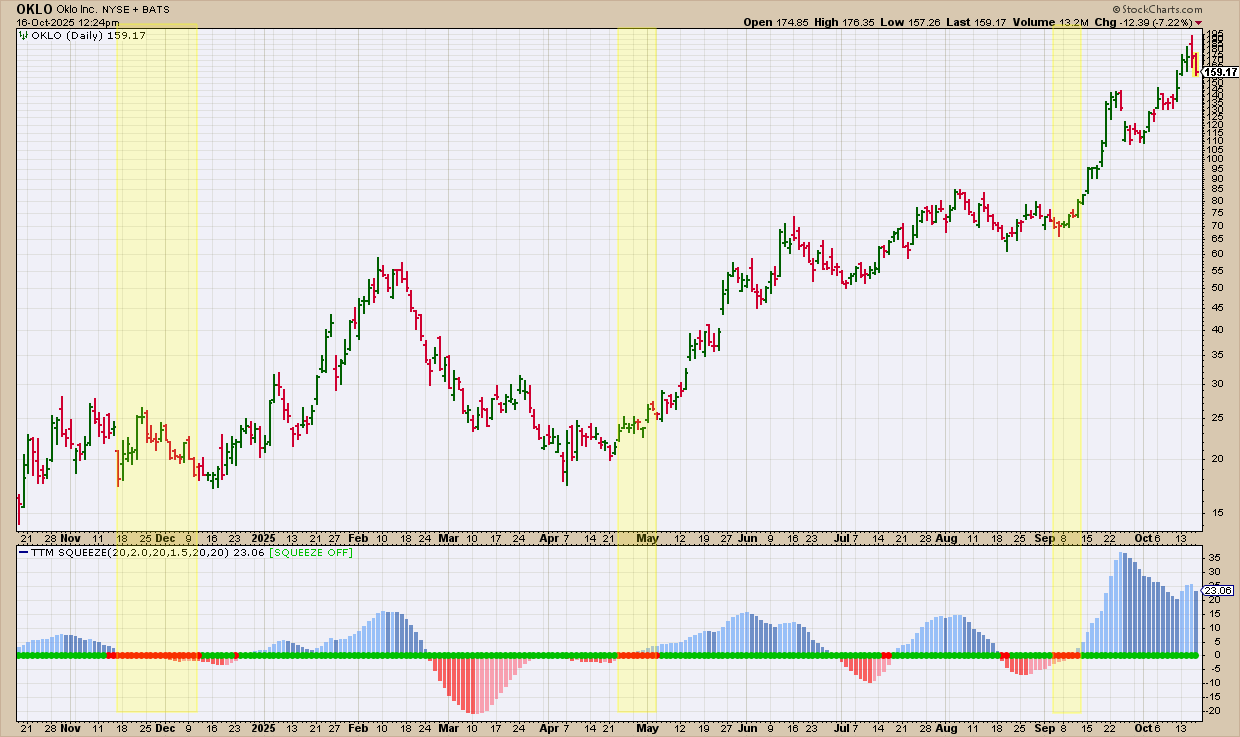
Notice how there are as many as six areas of red dots, but only three of them are shaded yellow. Now, based solely on price action and the TTM Squeeze indicator, here are a few things to ponder:
- If you were looking to go long, where would you place your entry, and why?
- Notice the long period of decline from February to April? How would you have trailed your stops to keep your profits?
Note this: Every trader will have their own approach to answering these questions. Some will use other indicators, while others may just look at the price action. My approach leans more toward the latter.
Here’s what I might have done:
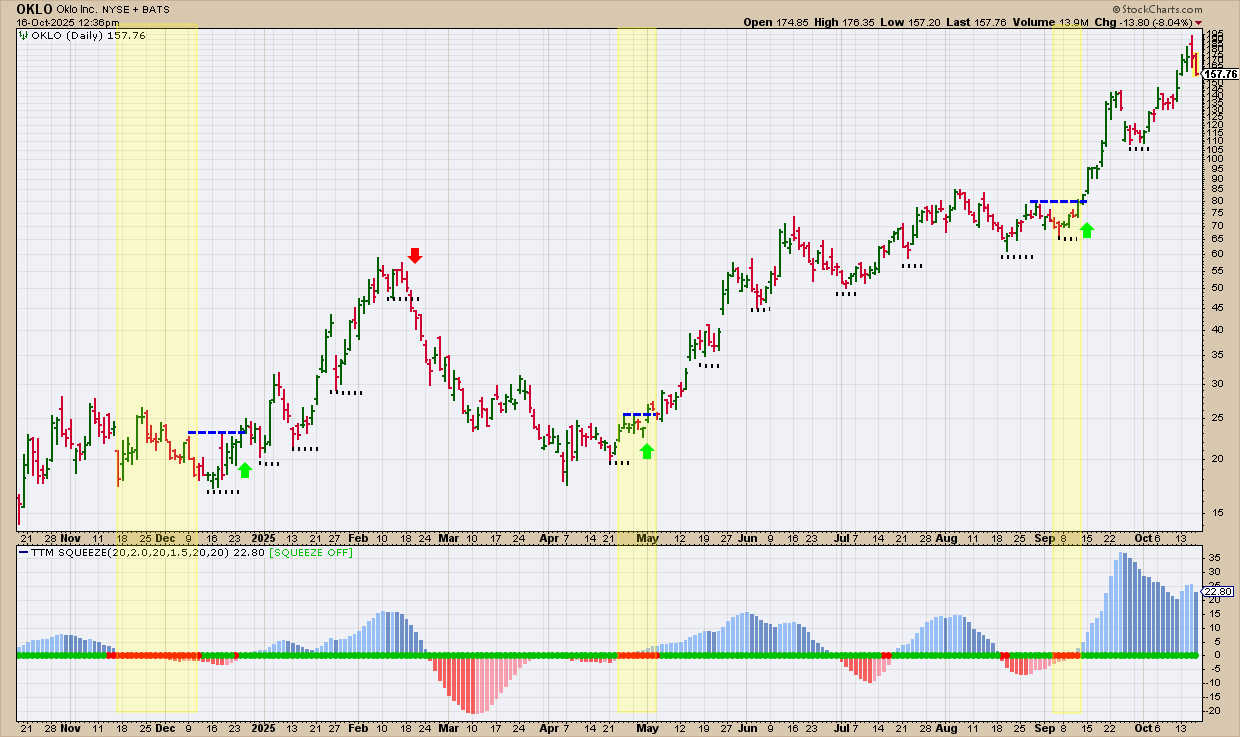
After a prolonged run of red dots (compression), watch recent swing highs for breakout levels. The blue dotted lines mark swing highs (and potential resistance) I’d use as long-entry triggers, and the green arrows show where those entries likely got filled.
See the black dots below the price bars? That’s the trailing stop—parked just beneath major swing lows. Quick trend check: uptrends = higher highs and higher lows; downtrends = lower lows and lower highs. Trailing stops at swing lows align with that structure. That’s my personal playbook—tweak it to fit yours. The red arrow in February shows where a stop loss would have been triggered.
And That’s a Wrap
So, what have you learned? Like the Bollinger Band Squeeze, the TTM Squeeze is another volatility-based indicator you can add to your toolbox to help you spot potential big moves before they happen. Try it on a variety of charts and see which ones might have anticipated big moves. Next time you spot a string of red dots, remember: the market’s pressure is building, and the insiders are waiting for the spring to trigger a release.


