StockCharts Insider: How to Spot Style Rotation Before the Crowd
Before We Dive In…
The market isn’t one story. It’s a dozen stories fighting for the spotlight. And depending on the day, a different one steals the show. One of the cleanest ways to read those stories is through Market Factors—Value, Growth, Momentum, Quality, and more. Spot which one’s leading, and you’re already ahead of most traders staring at a single index number. That’s what we’re tackling today.
How Can Market Factors Give You An Advantage?
When going through your Market Summary as part of your morning routine, you’ve probably glanced at this panel.
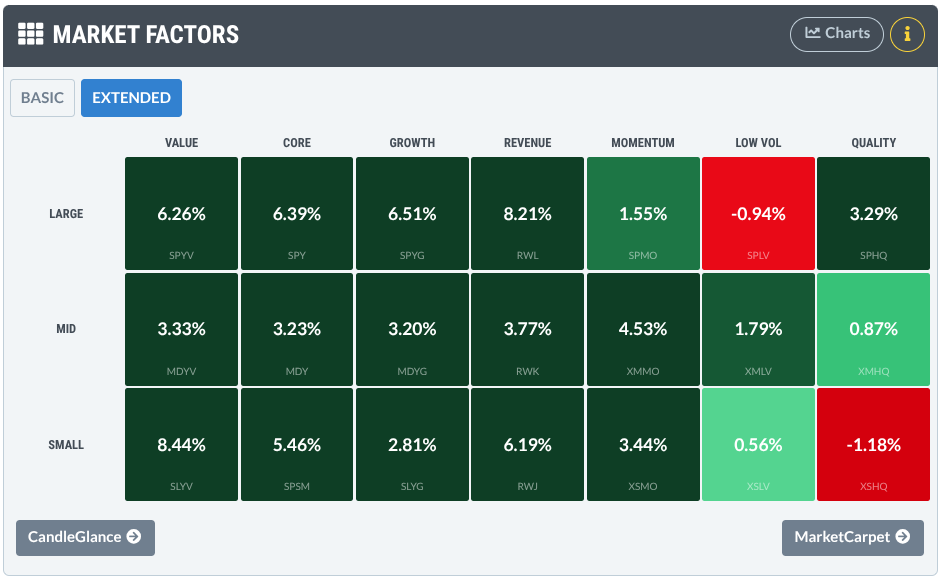
Looks simple enough, right? It shows groups of stocks and how they’re doing.
But here’s the secret: it shows you where the money is flowing right now. Not yesterday. Not last quarter. It’s happening right now. Why’s that so important?
It’s All About Style Rotation in Real Time
Each factor tells a different story. Value shows where investors see bargains. Momentum shows where traders see heightened acceleration. Quality shows where the pros are hiding if they sense that things are getting shaky.
If you can learn to read these shifts, you go from reactive to proactive. Let’s break down the cast.
The Market Factors - What They Represent
All of the market factors are represented by three ETFs, one each for large-, mid-, and small-cap stocks. I will list them in that exact same order for each factor.
Below, I’m going to explain to you what each market factor represents, regardless of market cap.
1 – VALUE
- What it targets: These are companies that look underpriced based on fundamentals. Think lower price-to-earnings (P/E), price-to-book (P/B), or price-to-sales (P/S) ratios. These are the “discount rack” stocks with solid earnings or assets the market hasn’t fully recognized yet.
- ETFs: SPYV, MDYV, and SLY
- Investor appeal: Value stocks tend to shine when the economy rebounds or interest rates climb. That’s when investors pivot toward real profits, not just promises, and cyclical sectors start to wake up.
2 – CORE (Blend)
- What it targets: This is a balanced mix of value and growth across large, mid, and small caps. It mirrors the overall market. There’s no heavy style tilt, just broad diversification.
- ETFs: SPY, MDY, and SPSM
- Investor appeal: Think of it as the “default setting” of the market. It’s the place money sits when it’s not making a big style bet.
3 – GROWTH
- What it targets: Companies with strong earnings and revenue potential. Most of these firms are about reinvesting their profits into innovation, expansion, and market share rather than dividends.
- ETFs: SPYG, MDYG, and SLYG
- Investor appeal: When optimism is high and rates are low, Growth becomes the market’s favorite adrenaline shot.
4 – REVENUE
- What it targets: These are stocks weighted by real world sales instead of market cap.
- ETFs: RWL, RWK, and RWJ
- Investor appeal: If you want to follow real business output instead of market-cap hype, this is the factor that strips out the noise.
5 – MOMENTUM
- What it targets: These are stocks that have generally been on a winning streak. Momentum strategies assume price strength tends to persist.
- ETFs: SPMO, XMMO, and XSMO
- Investor appeal: Built on the idea that “winners keep winning,” momentum attracts traders chasing strength. This story works best in trending markets but can reverse quickly when leadership rotates.
6 – LOW VOLATILITY (Low Vol)
- What it targets: This category groups stocks with historically smaller price swings and steadier returns. In other words, low beta and less noise.
- ETFs: SPLV, XMLV, and XSLV
- Investor appeal: These stocks don’t sprint. They typically stroll. And in choppy markets, slow and steady is much less nauseating than a rollercoaster ride.
7 – QUALITY
- What it targets: These are companies with durable balance sheets and strong cash flow. Think high profitability, stable earnings, and low debt.
- ETFs: SPHQ, XMHQ, and XSHQ
- Investor appeal: Think of quality as the “adult” in the room: calm balance sheets, steady profits, and fewer surprises.
Now That You’re In the Know, What Will You Get Out of This?
Market factors show you the market’s mood by tracking where capital is actually flowing. These hint at whether investors are feeling bold, greedy, cautious, straight-up defensive, or a mix of all four.
So, when you see headlines like “The S&P 500 is up 1%,” you don’t stop there. The real question is you want the answer to is: what’s powering the move? Is growth doing the heavy lifting? Are value names waking up? Are momentum stocks taking the lead?
That’s where genuine insight begins. Once you know which factor is in control, you’re no longer guessing about the market’s personality. Your advantage is that you can spot rotations early; time your entries and exits more strategically; and know when your stocks are going with or against the tide.
A Few Insider Tips to Consider
Insider Tip - Line Them Up: This is an easy one. Line up Momentum, Quality, Low Vol, and the rest to see which market sentiment is dominant and outperforming.
Insider Tip - Turn Them Into Ratios: Compare SPYG vs SPYV (type in SPYG:SPYV in the ticker window) to see if Growth or Value has the upper hand. Use ratios to view relative performance.
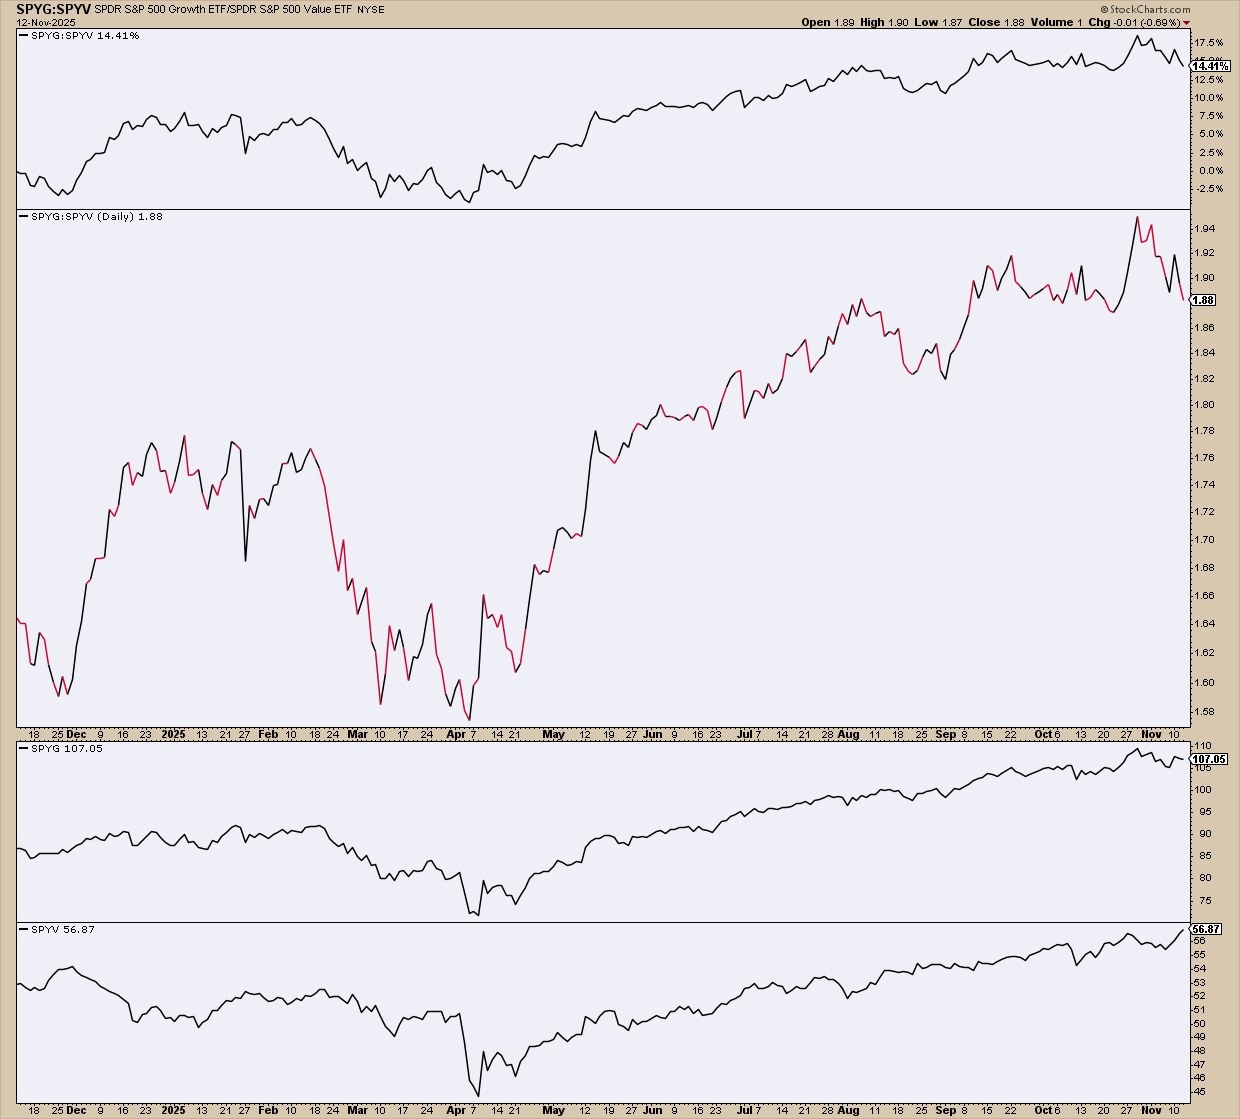
The example may be overkill, but the top window shows relative performance (growth outperforming value by over 14%), the chart plots a growth-to-value ratio, and the panels below show growth and value performance separately.
Insider Tip - Use RRG (Relative Rotation Graph): Watch which factor ETFs are rotating into (or out of) leadership.
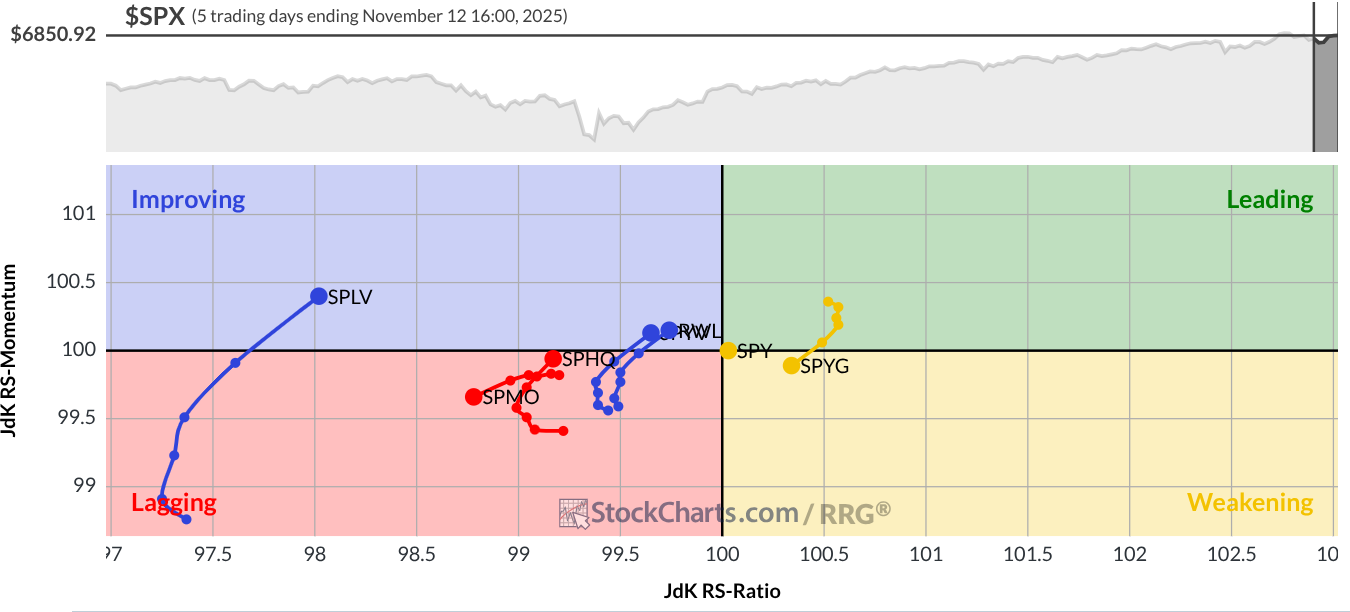
This visually tracks market leadership for each factor. The current setting for the above Relative Rotation Graph (RRG) Chart is for a 1-year period, using the daily chart setting. Which factors are weakening, lagging, improving, and leading? What kind of rotation is taking place? Your job as a chartist and trader is to figure out why, and to turn those insights into actionable decisions.
And That’s a Wrap
Don’t swipe past the Market Factors. They’re the cheat sheet to who’s actually steering the market on any given day.
When you track which styles are leading, losing steam, or lagging, your charts instantly make more sense and your decisions become clearer. It’s all about spotting leadership shifts, because that’s where opportunities and warnings usually appear first.
So the next time SPY makes a big move, don’t just ask how much. Ask who moved it. That’s where the real story is.


