StockCharts Insider: How to Use Retail Sentiment as a Risk Gauge
Before We Dive In…
In a previous article, we went over “smart money” positioning in the market. Now, let’s talk about your fellow retail investors. How are they feeling about the market, and what difference would it make if you were able to track their overall sentiment on a weekly basis? Let’s suppose you find out. Would you trade with the crowd or against it?
That part’s up to you. But measuring and tracking retail sentiment is possible. There’s a tool for it. And that’s what we’re going to cover today.
How Do You Measure Retail Investor Sentiment?
There’s this non-profit called American Association of Individual Investors (AAII). They publish a sentiment survey based on a weekly poll of individual investors/members.
Each week, participants are asked a simple question: “Do you expect the stock market (typically the S&P 500) to be up, down, or unchanged over the next six months?”
The responses are tallied into bullish, neutral, and bearish percentages. StockCharts provides multiple ways to visualize this data, making it easy to track these readings. Check it out below:
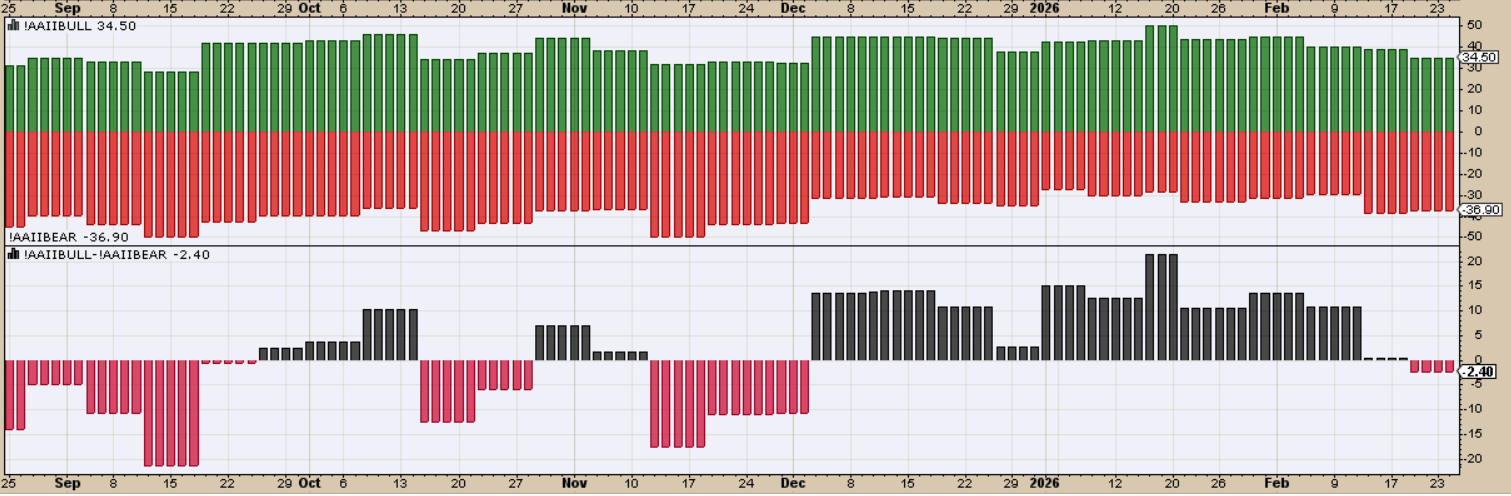
First, note that each bar in the histogram represents data from one week.
- !AAIIBULL vs !AAIIBEAR: The indicator panel displays the percentage of bullish respondents (green) alongside the percentage of bearish respondents (red), allowing you to visually compare shifts in optimism and pessimism over time.
- !AAIIBULL minus !AAIIBEAR: This indicator calculates the weekly Bull/Bear spread by subtracting the percentage of bearish respondents from the percentage of bullish respondents. The result oscillates above and below zero, reflecting shifts in sentiment.
Your task is to interpret this data within its broader market context. The AAII sentiment survey does not generate trading signals, Instead, it provides some psychological background. In other words, price action still leads.
Bullish sentiment typically struggles to sustain readings above 50% and only rarely pushes into the 60% zone, even during strong advances. Conversely, during sharp downturns, bullish readings seldom collapse much below 20%.
So, How Can You Use It?
Remember, this is all about the backdrop. It’s not a buy/sell trigger. Before making any decision, ask: Is the market structurally bullish or bearish? How are retail investors responding to this structure, sentiment-wise?
For this example, we’ll use the Ichimoku Cloud for trend context. (And yes, the 40-week SMA ≈ 200-day SMA, for those keeping score.)
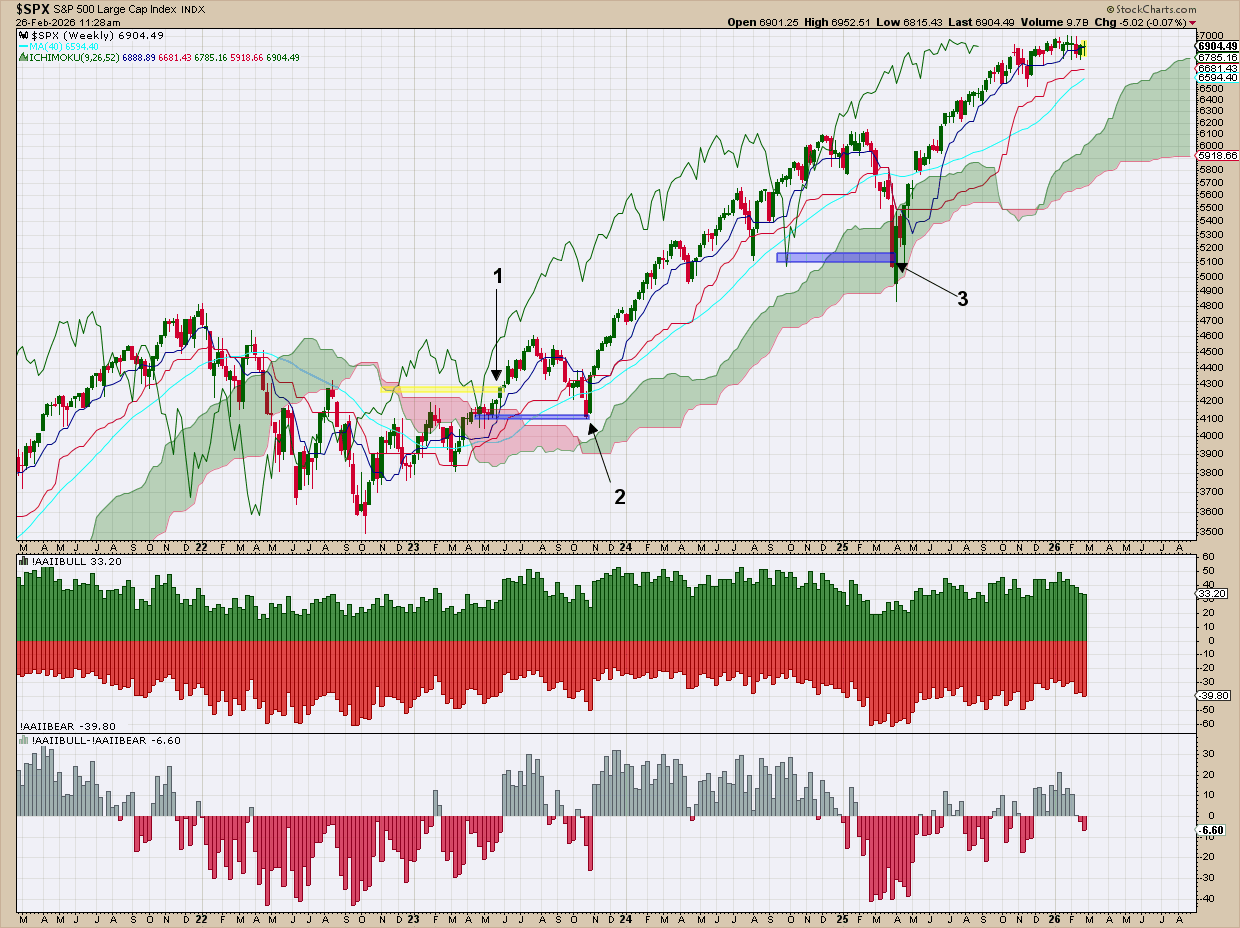
1 - The Breakout Nobody Trusted
- Price breaks above a prior swing high.
- The Cloud flips from red to green.
- The Chikou Span clears price from 26 periods back (see yellow-shaded bar).
That’s a reasonable degree of structural confirmation. But look at how AAII: Retail sentiment is still net bearish — even though it’s improving.
What might that mean? Price turned first. Sentiment lagged. Retail hesitation often shows up in the early stages of subsequent, sustainable uptrends.
2 - The “Is It Failing?” Pullback
- Price dips below the 200-day equivalent.
- Retail sentiment turns bearish again.
- Fear picks up.
Structurally, price stays above the Cloud as it turns green. But the broader Ichimoku framework—arguably a Kijun sen retest—stays bullish.
What you’re looking at is a classic mismatch. Retail freaks out and gets defensive. Meanwhile, structure stays constructive. Those are often “buy-the-dip” zones; not because sentiment is bearish, but because bearish sentiment appears inside an intact uptrend. That’s the nuanced take.
3 - The Real Scare (and a legit one)
Now we get a deeper correction:
- Price slices below the 200-day (nothing good happens under the 200, as they say).
- Chikou Span drops under prior price.
- AAII shows multiple weeks of bearish readings.
This time, fear makes more sense. But then something interesting happens: Price stabilizes at the Cloud. Structure rebuilds. Eventually, the uptrend resumes. Retail sentiment improves slowly, reluctantly, even as price keeps advancing.
So What Does This Tell You?
Retail sentiment isn’t always accurate in leading turns, whether they’re major reversals or smaller corrections. Sometimes, they’re right on; other times, they’re a bit off. However, they’re quick in reacting to volatility.
With that said, AAII extremes are not the best tools for timing bottoms or tops. It’s a risk-regime gauge.
- When sentiment is deeply bearish inside a structurally bullish market, that tension may signal opportunity.
- When sentiment is euphoric while structure is deteriorating, that’s another warning.
So Where’s the Edge?
When price structure and retail sentiment diverge, pay attention. AAII helps you measure emotional temperature. Compare that to market structure. Mismatches between the market and sentiment may signal opportunity.
Insider Tip: AAII vs. NAAIM – Same Mood, Different Money
As AAII measures how retail investors feel, the NAAIM Equity Exposure Index measures how active managers are actually positioned, “small players” and “big players” alike. Sometimes, they move together. But the interesting moments happen when they diverge.
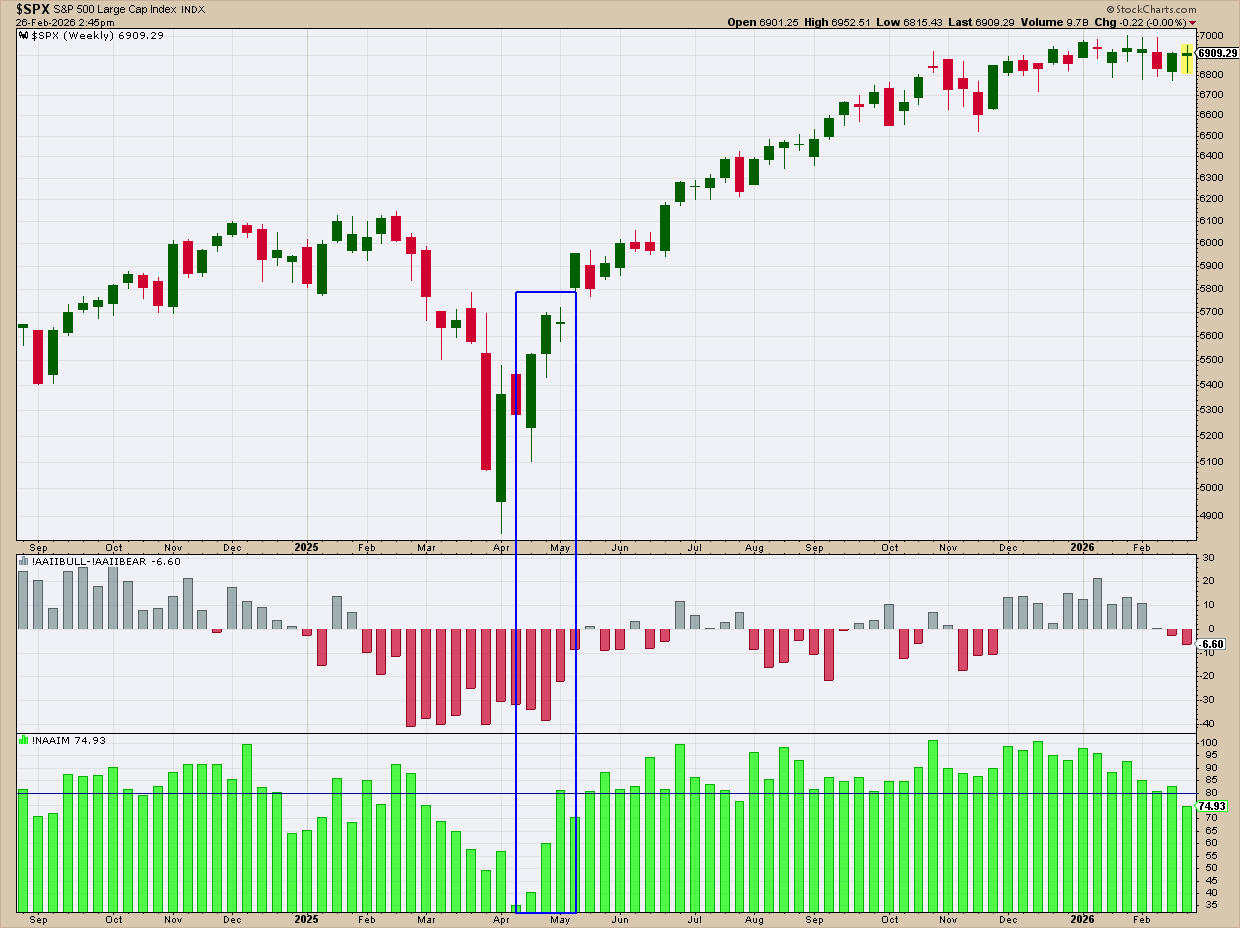
The blue rectangle shows NAAIM jumping above 80 in just three weeks. Managers are leaning in. Retail? Still net bearish. Meanwhile, price is rebounding off a relative low. Otherwise, both retail sentiment and manager positions are not that different.
Here’s why this matters: If AAII reveals sentiment, NAAIM reveals real capital commitment. When AAII and NAAIM diverge near sentiment extremes, that tension can signal a transition in risk conditions.
And That’s a Wrap
AAII won’t call tops or bottoms, but it can reveal when fear builds inside strength, or when optimism creeps into weakness. When sentiment and structure align, trends tend to stick. But when they diverge, risk may be shifting. Joining or fading the crowd isn’t the point. The important thing is to recognize when emotion and price fall out of sync.