StockCharts Insider: Ichimoku’s Forgotten Line - The Chikou Span (and How It Can Help You)
Before We Dive In…
The Chikou Span is arguably the most overlooked, most underestimated, and most underutilized part of the Ichimoku Cloud.
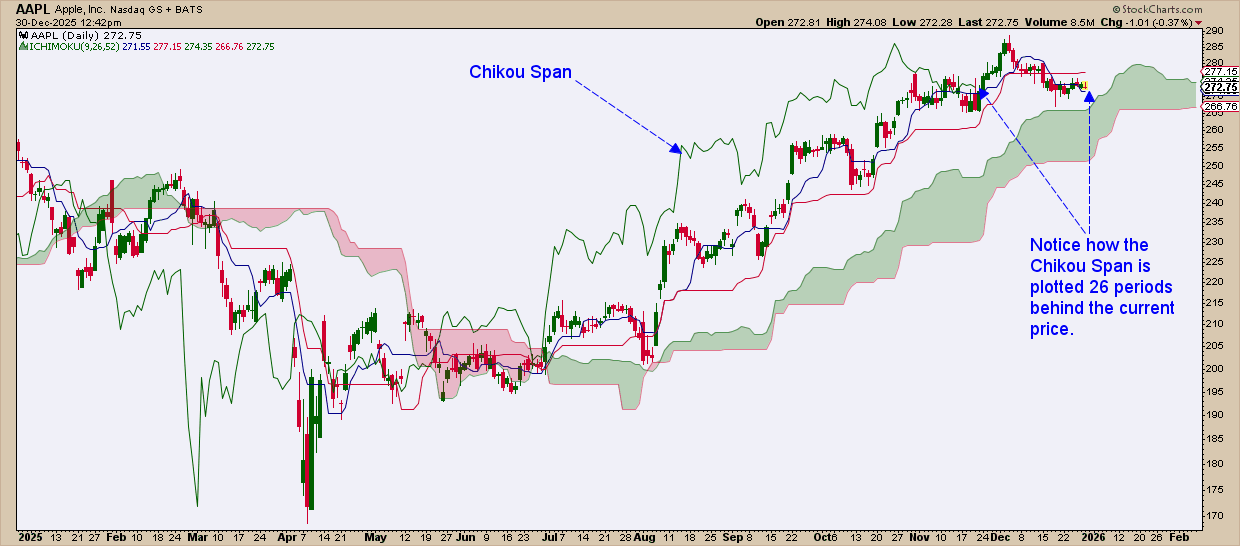
At first glance, it doesn’t look like much. It simply takes today’s closing price and plots it 26 periods back. If you’re focused on what’s about to happen next, you’re probably wondering "why should I care about projecting the present into the past?" But doing so gives you a few quiet advantages, like telling you whether current price action has room to develop or whether it’s about to collide with prior market structure. It also provides context for whether other Ichimoku signals are likely to work (or not).
What the Chikou Span Is (And What It Isn’t)
The Chikou Span, also called the Lagging Span, is simply the current closing price shifted back 26 periods. The choice of 26 isn’t arbitrary: it roughly reflected a full trading month in Japan at the time Ichimoku was developed, when the standard workweek was six days long.
That function probably seems a bit eccentric, as in “why am I looking backward in that specific way?” Perhaps it’s why the component is often misunderstood. In practice, the reasons are much simpler. The Chikou Span gives you:
- A confirmation filter, helping you avoid signals that lack room to develop.
- A context check, showing whether current price action is running into prior market structure.
- A validation layer, confirming whether other Ichimoku signals are likely to follow through.
In classical Ichimoku interpretation, the read is straightforward:
When the Chikou Span is above the candlesticks (and the cloud) from 26 periods ago, the broader market phase is potentially bullish. When it is below, the bias is bearish.
This positioning doesn’t generate entries—it confirms whether momentum is aligned with, or fighting against, the prevailing trend.
Looking Backward to See Forward
As the saying goes, markets have memory. Past highs, lows, and congestion zones mark important decision points that impacted price action. If price reaches back to those areas, traders are likely to “negotiate” those points again.
By visually superimposing today’s prices back into that historical structure, the Chikou Span shows whether momentum is moving into an open space or directly into an area of friction.
When the Chikou is clear of past prices, the traditional forecast is that current signals have room to breathe. When it’s tangled in prior congestion, follow-through may be less reliable. This might be confusing, so let’s dig into it a little deeper.
The Three Chikou Conditions That Matter
1 - Chikou Above Past Price
Think of it as “bullish permission.”
When the Chikou Span is clearly above the price action (and the cloud, aka, the Kumo) 26 periods back:
- Former resistance has been cleared.
- Current bullish momentum doesn’t see immediate obstruction.
- Bullish Ichimoku signals have a higher probability of success.
Now, this doesn’t guarantee that price will move higher (no indicator can do this), but it does confirm that potential upside movement doesn’t have any immediate constraints.
2 - Chikou Below Past Price
The exact opposite, like “bearish permission.”
When the Chikou sits below prior price and the cloud, it tells you that:
- Former support has already failed.
- Downside momentum isn’t blocked by any past price action.
- Bearish Ichimoku setups have space to develop.
Again, this isn't a trading signal. It’s clearance for any bearish setups or signals that might develop.
3 - Chikou Tangled Up in Price
It’s like a No Trade Zone.
This is one of the most important, and most ignored, conditions. When the Chikou is tangled up in past price action (or the cloud):
- The current market is entering a period of past congestion.
- Breakouts tend to stall.
- Signals, bullish or bearish, are prone to failure.
Here’s an Insider Tip: If Chikou is stuck in old price traffic, consider standing down, even if everything else seems to line up.
Let’s look at the same AAPL chart, but examine it with these principles in mind.
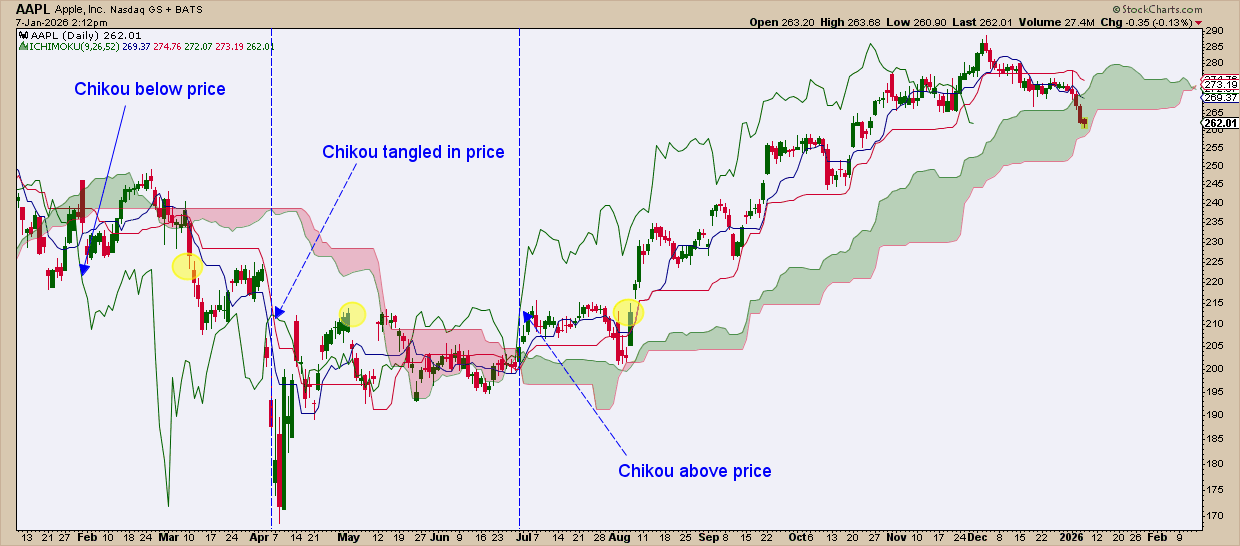
- Right panel: The Chikou Span is clearly above price (and cloud) from 26 periods back. The yellow circle shows where price was at the time of the shift. Once price broke out of its range, you'll notice how momentum had room to run.
- Middle panel: The Chikou is tangled in prior price action. The result? Chop, stalls, and little follow-through.
- Left panel: The Chikou Span drops below price and the cloud. Downside opened up, and price moved with less resistance.
The takeaway is simple: the Chikou Span doesn’t predict direction. Instead, it shows whether price is boxed in or free to move.
Insider Tip: What to Avoid
Today’s Insider Tips are best expressed in the negative:
- Don’t expect the Chikou Span to generate trade entries.
- Don’t ignore it just because it lags.
- Don’t overanalyze the exact touchpoints at the expense of the overall structure.
Remember: The Chikou Span works best when used simply as confirmation, not prediction.
And That’s a Wrap
The Chikou Span doesn’t tell you when to pull the trigger. It tells you whether thinking about pulling the trigger makes sense in the first place. By looking at the past, it helps filter out potentially bad signals that otherwise look good in the present, revealing an important layer that may be hidden from the current price action. That’s a quiet advantage, and one many traders don’t realize they’re missing.


