StockCharts Insider: John Murphy’s Law #10 — Know the Confirming Signs (Volume)
Before We Dive In…
Price can advance a bullish or bearish argument. But volume reveals the true conviction behind the case. That’s the core of John Murphy’s Law #10. A rally that isn’t attracting buyers? A selloff nobody’s committing to? A breakout nobody cares about? Those are moves on borrowed time.
Volume is the market’s conviction meter and a reliable confirmation tool before pulling the trigger.
What’s the Core Idea Behind Law #10?
Volume tells you if a trend has real conviction behind it—or if price is simply drifting on leftover momentum. Watch it closely in four key moments:
- Strong trends: volume fuels the move
- Weak trends: volume dries up or contradicts price
- Breakouts: no volume = no trust
- Reversals: volume often hints at the turn before price does
As OBV-creator Joseph Granville put it, “volume precedes price.” So, if price is the headline, volume is the fine print that tells you whether the story checks out.
How Murphy Wants You to Use Volume
1. In Trends, Volume Should Back the Move
An easy analogy would be to think of volume as the gas pedal:
- In an uptrend, rallies should have more volume (think “buying pressure”)
- In a downtrend, selloffs should also have an increase in volume (selling pressure)
- When volume fades during a trend leg, the trend is running out of fuel
Going back to our analogy, if the “gas” doesn’t show up, expect stalls or reversals.
2. Breakouts Need Volume
Murphy’s rule: no volume, no trust.
- Breakout + strong volume 🠊 real
- Breakout + low volume 🠊 fakeout risk
- Breakdown + strong volume 🠊 serious selling pressure
- Breakdown + weak volume 🠊 suspect move
Think of volume as the vote count behind every breakout.
3. Volume Warns of Trend Exhaustion
The best early warning signs aren’t always in price. Sometimes, they’re in volume:
- New highs on weak volume
- New lows on weak volume
- Rallies or selloffs getting quieter
- Patterns forming on declining volume
When volume fades but price keeps inching forward, it hints of a weakness that you should take seriously.
4. Volume Spikes Can Mark Turning Points
While volume is needed to continue driving strong trends, huge volume surges can also flag emotional extremes:
- Blow-off tops: euphoric, vertical moves that often signal the last hurrah before a decline
- Selling climaxes: panic-driven dumps that often mark the beginning of a bottom before a recovery
Both cases signal exhaustion. You may see volume spike before price reverses; sometimes, you’ll see it right at the turn.
Indicators That Confirm What Volume Is Really Saying
On-Balance Volume: Use On-Balance Volume (OBV) to confirm the broader trend. The OBV is all about participation—it tells you if the crowd is backing the move.
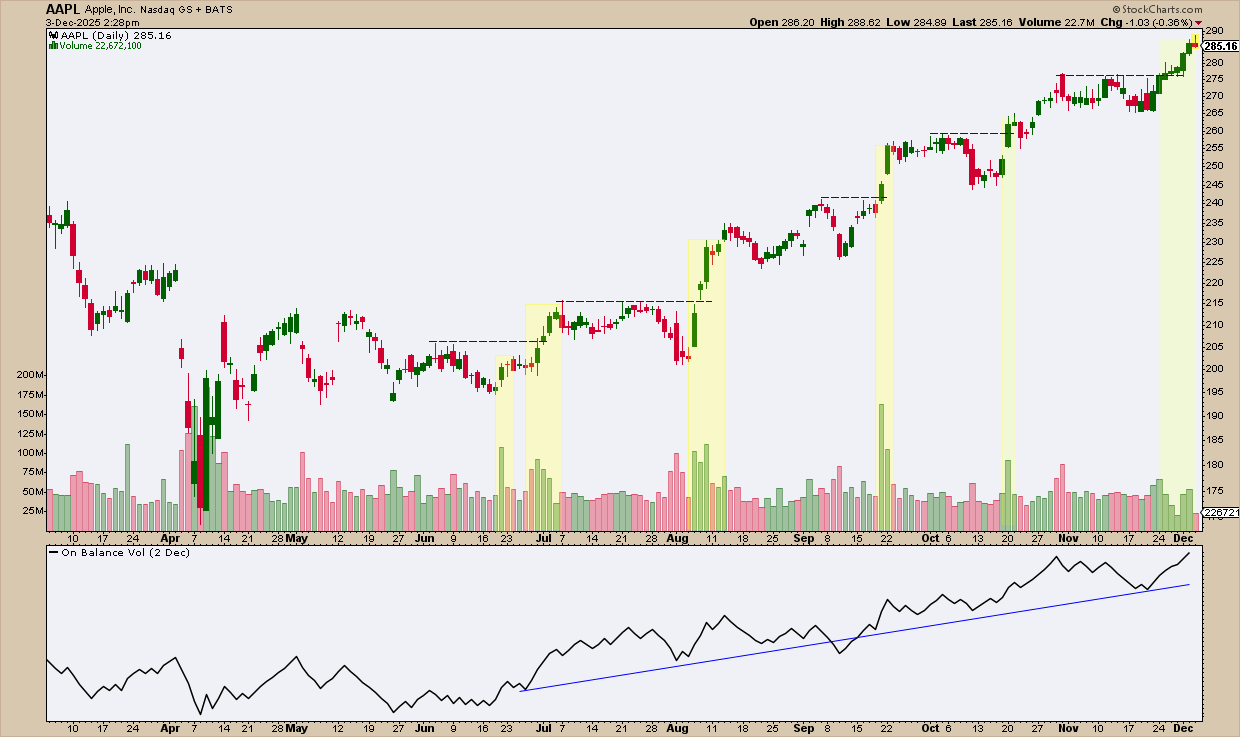
FIGURE 1, DAILY CHART OF APPLE, INC, (AAPL). Look at both volume and the (more cumulative) OBV.
Notice the spikes in volume at every major breakout point? That alone tells you something. But if you plot the OBV below it, it shows you how much, on a cumulative basis, volume supports the trend.
Chaikin Money Flow: Use Chaikin Money Flow (CMF) to spot quick money flow shifts inside the trend. The CMF conveys buying and selling pressure. Because it calculates the position of the close within each bar, it’s more sensitive to near-term price changes. Ultimately, it can tell you whether tug-of-war within the broader trend is starting to shift.
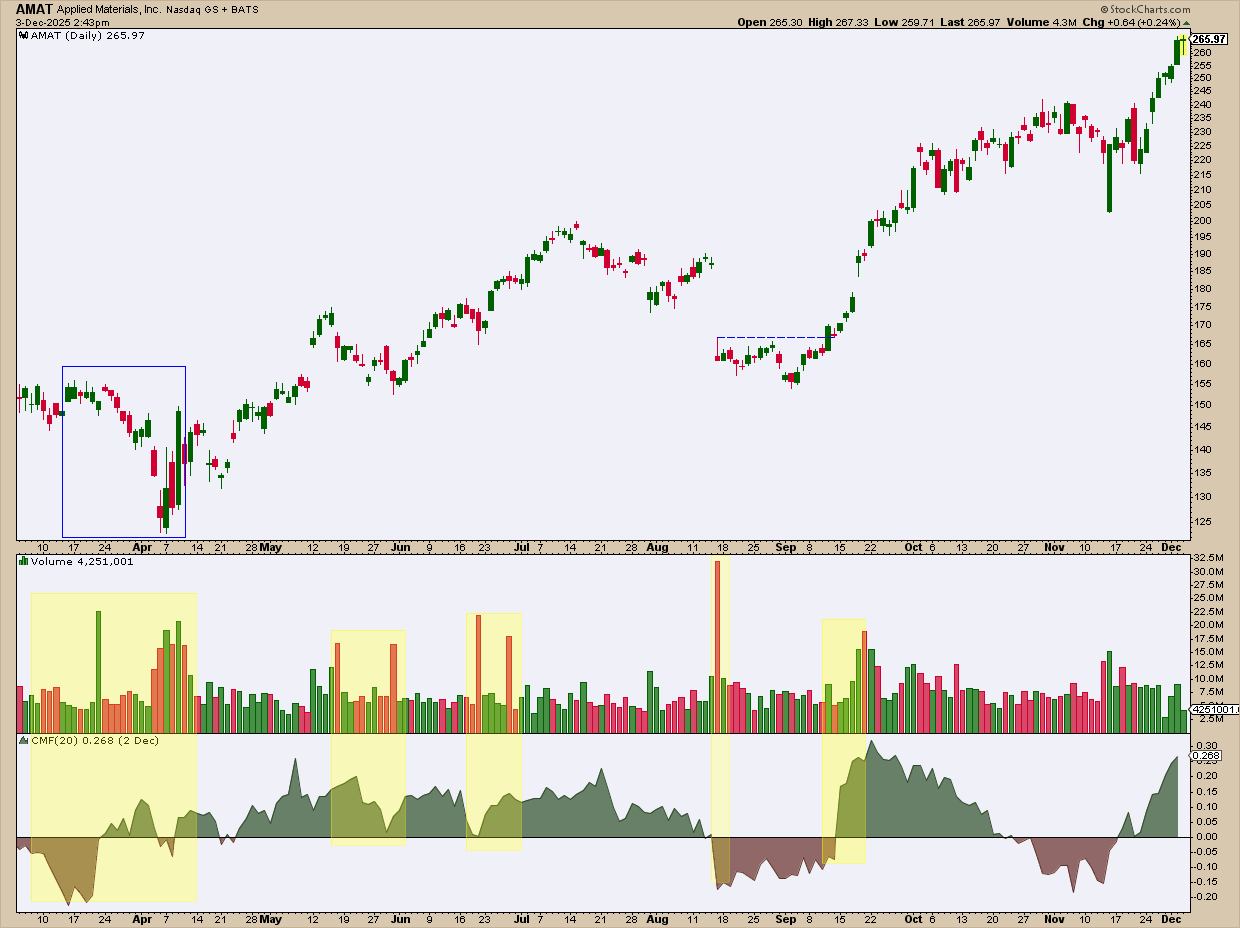
FIGURE 2. DAILY CHART OF APPLIED MATERIALS (AMAT). It’s a little tricky and busy, but look at the volume, CMF, and price action.
When the CMF is above the zero line (when it’s green), buying pressure is dominant. Below zero, sellers have the edge.
Look at the price action in the blue rectangle. See how CMF flips from selling to buying pressure while price makes a new low? That divergence was an early warning that the downtrend was about to bottom-out and reverse.
And despite the sharp selling spikes in May and June, CMF stayed positive, confirming the strength of the uptrend. That trend got disrupted in August, then snapped back sharply in September as CMF turned positive again.
A Few Insider Tips
Insider Tip #1: Watch Volume Trends, Not Just Spikes
The daily volume almost always looks jagged and messy. That’s why you use tools like the CMF or OBV. They show you, on a smoother, more continuous, or cumulative basis, whether money is flowing in or out.
Insider Tip #2: Volume Precedes Price
When volume jumps before the breakout, pay close attention. Smart money sometimes moves early, and that can be your signal.
Insider Tip #3: Match Volume Behavior to Trend Context
In a trend, follow volume expansions. In a consolidation, look for anomalies (big bursts, sudden drops). Volume indicators help you understand the bigger price structure; they don’t predict price structure.
Insider Tip #4: Not Every Market Behaves the Same
Stocks that trade in high volume, like mega-caps, might need larger spikes to signal significant moves. Less liquid stocks, on the other hand, may be subject to exaggerated moves and erratic volume signals.
In all cases, context matters more than absolute levels.
And That’s a Wrap
Volume is the final checkpoint in Murphy’s 10 laws. It marks the difference between setups with real sponsorship and those running on wishful thinking.
Remember: when price talks, volume either confirms the story, or exposes the bluff.
Apply this law and you’ll optimize the previous nine.


