StockCharts Insider: John Murphy’s Law #2 — Spot the Trend and Go With It
Before We Dive In…
Hopefully, you’ve read our first article on mapping the trends (John Murphy’s Law #1). Once you’ve figured out how to do this, the next question is simple: What do you do with it? Welcome to our article on Law #2. This principle is all about aligning with the trend’s direction. In short, Murphy’s second law teaches one of the oldest truths in technical trading: The trend is your friend until it ends.
The Core Idea Behind Law #2
Markets are either trending (up or down) or they’re not. When they’re not trending, they’re moving sideways—fluctuating up and down but making no new highs or lows (i.e., going nowhere). The main idea is simple—follow the trend, don’t fight it.
Now, here’s the tricky part: Markets don’t actually trend most of the time. Over the decades, some technicians have estimated that prices spend only about 25% to 30% of their time trending, and the other 70% to 75% just moving sideways. This isn’t a hard fact, but it’s an important rule of thumb.
When a trend is taking place, some traders still make the common mistake of going against it, even when they don’t mean to. Sound strange? Here’s how it plays out:
- They see a rally and think, “It’s gone too far; it’ll fall soon.”
- They see a selloff and think, “It’s down so much it can’t go any lower.”
The rest—along with a portion of their trading account—is history.
On the flip side, momentum tends to persist. Prices often go further than reason or emotion would predict. Your best bet is to go with the trend. Let the market, and not your bias, tell you when it’s time to get in or out.
Spot the Three Trend Layers
The topic of trend spotting is a big one, but we’re not going to cover that right now. I assume you have your own method of identifying and confirming trend direction. Maybe you’re using moving averages, drawing trendlines (something we’ll cover in Law #5), or measuring swing points (my preferred method).
The point here is to distinguish the long-term, intermediate-term, and short-term trends.
Here’s what you want to look at:
- Monthly charts reveal the long-term trend.
- Weekly charts capture the intermediate-term trend.
- Daily charts show the short-term trend.
If you’re a day trader, you’ll want to look at even shorter timeframes. But for now, let’s stick with the ones bulleted above.
Once you’ve identified each one, see if any of the trends agree in terms of direction. Find the trend that’s most relevant to your timeframe and go in that direction, not against it.
Insider Tip: If the long-term and intermediate-term trends are going in the same direction, and the short-term is moving against them, you might be looking at a pullback, not a trend reversal. A smart trader would use that pullback as an entry opportunity in the direction of the prevailing trend.
An Example: Meta Platforms (META)
Take a look at a daily chart for Meta Platforms (META).
Daily Chart — Spotting the Short-Term Setup
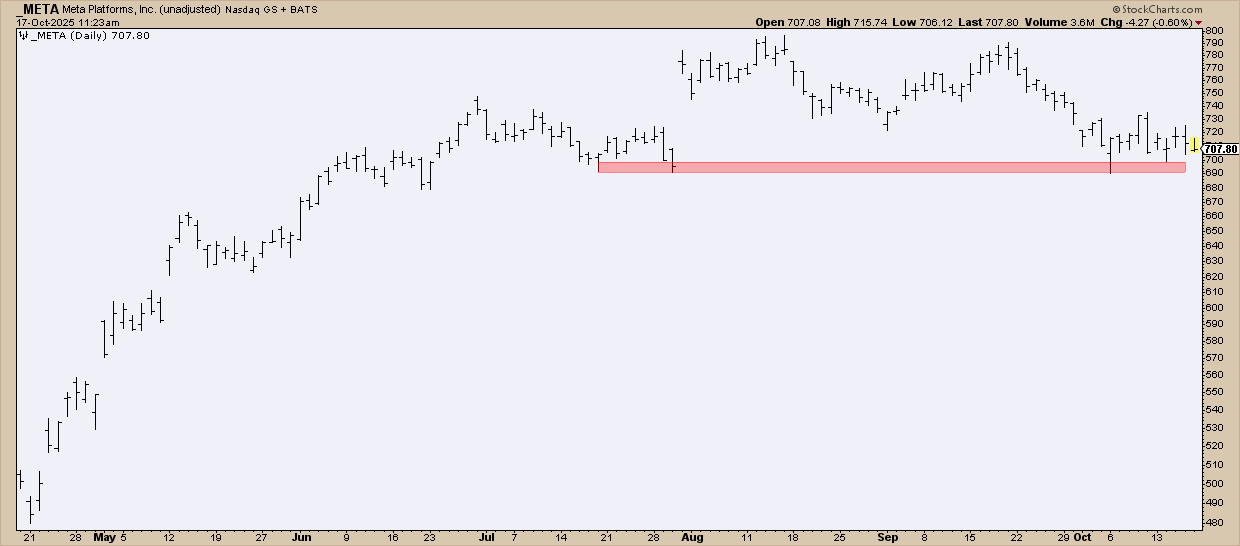
See the support level shaded in red? If price falls below it, further downside is a possibility. But here’s the question: What’s the bigger picture? Is META actually topping and poised for a short-term downtrend, or is this just a pullback within a larger uptrend? This is where it helps to look at the larger trend.
Weekly Chart — Finding the Intermediate Trend
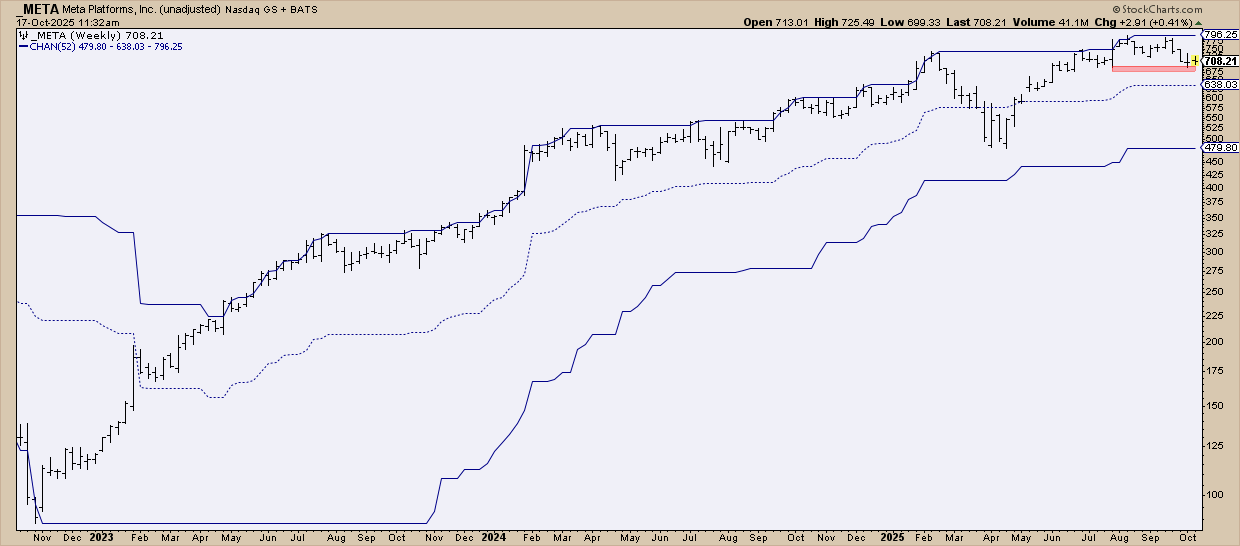
When you zoom out to a three-year weekly chart, that same red support line is still visible. But now you can see how it fits into a much wider structure. The 52-week Price Channel frames META’s moves across a full year’s range, showing whether this dip is testing the lower boundary of a major uptrend or setting up for something bigger.
By the looks of it, at the time of writing, META is pulling back to test the middle range of a strong intermediate-term uptrend. The decline, if it happens, can appear deep on a daily chart but, from a broader context, META’s uptrend is still intact.
Now, how might this look in an even broader context? Let’s take a look at a monthly chart.
Monthly Chart — Zooming Out to the Big Picture
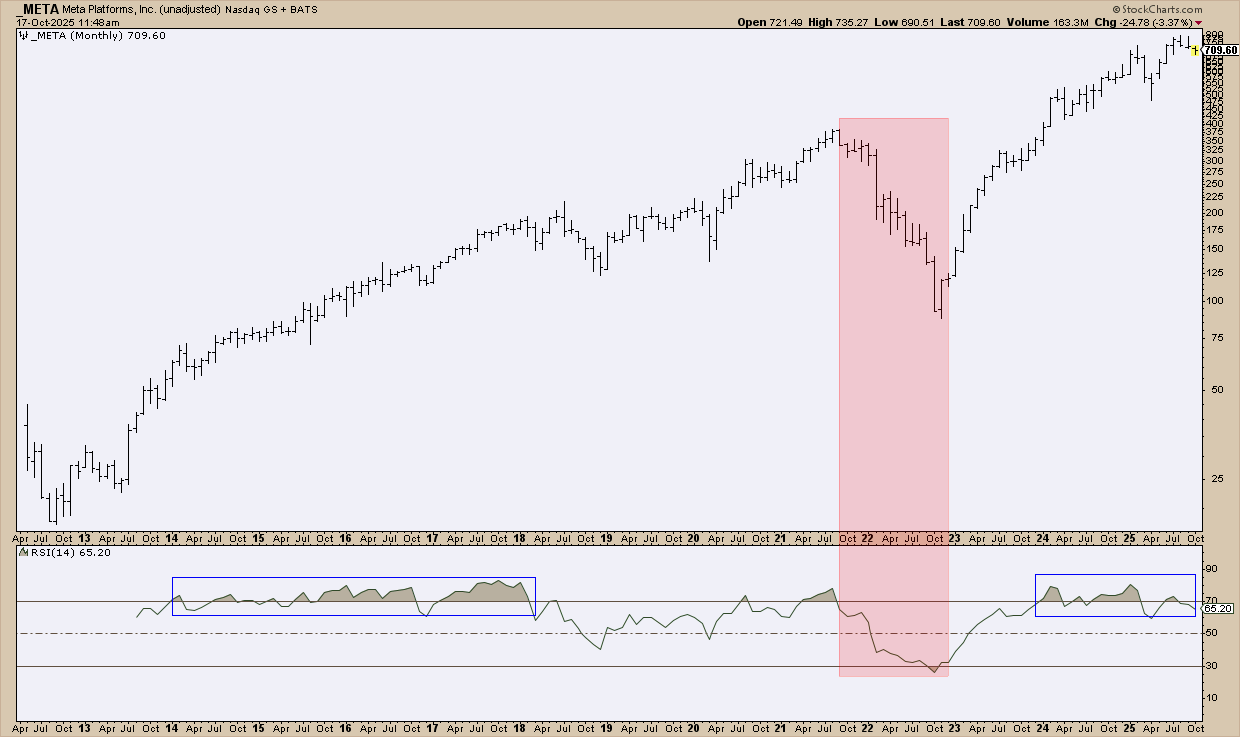
Okay, here’s where we need to zoom out and add some nuance to see the bigger picture. This chart goes all the way back to META’s IPO in 2012.
First, take a look at the Relative Strength Index (RSI) plotted below the chart. See the long stretch of “overbought” readings? Contrary to popular belief, an overbought condition can often signal strength, rather than impending weakness. (I covered this previously in StockCharts Insider: How an “Overbought” RSI Can Be Your Best Buy Signal. It’s worth a look if you missed it.)
See how META’s RSI stayed above 70 from roughly 2014 through 2018, while price kept climbing even as RSI briefly dipped below that level? Now fast-forward to 2024 and the RSI has once again broken above 70. Could that be another sign of renewed strength?
What Happened Between 2021 and 2023?
But here’s the twist: if sustained overbought readings reflect strength, and oversold readings hint at potential weakness, how do we explain what happened between 2021 and 2023 (the red-shaded zone), when the RSI plunged from overbought to oversold in less than two years?
The 2022 plunge wasn’t about one bad quarter. Instead, META faced a “perfect storm” scenario. Meta poured billions into its metaverse while ad revenue stumbled. Add inflation, soaring interest rates, and slowing user growth, and investors started questioning whether META’s “Reality Labs” was burning cash faster than it could innovate.
The result? A sharp downturn that transformed a Wall Street darling into a cautionary tale—until its turnaround began.
Now you can see Law #2 in action: Trends don’t just differ by length. They’re often powered by different mechanics altogether, from short-term supply and demand to longer-term economic and (sometimes) geopolitical factors.
Takeaway: Zooming out can help you spot the larger trend powering the one you’re trading. The wise move is to use this context to distinguish a natural reaction from a critical reversal.
A Few Rules of Thumb
Here are a few basic tips that align with Law #2:
When the market’s trending up:
- Dips: Buy dips near support levels (you’ll have to use your preferred measure or indicator to determine where support may be).
- Pullbacks: View them as potential entry points, not exit signals.
- Confirm: The bounce should exhibit strong volume and preferably take place above a major swing low.
When the market’s trending down (only for those who go “short” the market):
- Bear rallies: Sell rallies near resistance levels.
- Failed breakouts: Look for failed breakouts or lower swing highs to re-enter.
- Confirm: This is the reverse of a “falling knife” scenario. Don’t sell into strength. Wait for the price to fail, and then short.
When the market’s sideways:
- Avoid: If your aim is to follow a trend, use sideways markets as a time to anticipate new trends.
- Range-trading: Range-trading strategies are tricky and carry their own unique risks. But if this is something you already do, well, it’s the perfect setup for such mean-reversion strategies.
- Use the right indicators: Tools like the Stochastic Oscillator and Bollinger Bands tend to work well in choppy markets.
Two Insider Tips to Consider
Insider Tip: Know when a trend actually ends. Every trader talks about “riding the trend,” but how do you know when that ride is over? There are many ways, actually. It's important to use tools that define trend structure, like ZigZag, moving averages, or basic trendlines.
Caveat: None of these are perfect, and that’s where your interpretive skills come into play. You might even use a few different methods to figure out whether your trend thesis is no longer valid.
Insider Tip: Be clear about which trend you're following. The trend may be your friend until it ends, but which trend are you talking about? A trend in a five-minute chart? One-hour chart? Daily chart?
Every timeframe has its own version of “the end,” so it’s important to define your horizon and to see whether the broader time frame (like the daily chart to the one-hour chart) is also driving the trend you’re looking at.
And That’s a Wrap
Here’s what we covered so far: Law #1 taught you to map the terrain. Law #2 tells you to follow that path. Once you’ve spotted the trends, trade with—not against—the trend that’s relevant to your timeframe.
And if you like to “fade” things, remember that the secret isn’t jumping on a trend before it materializes—it’s having the know-how, patience, and discipline to spot it and to stay with it until it completes.


