StockCharts Insider: John Murphy’s Law #3 — Find the Low and High of It (Support & Resistance)
Before We Dive In…
If you could spot where price is likely to bounce, stall, or reverse, you’d probably time entries and exits a lot better. That’s Law #3: find support and resistance—plus the polarity principle, where broken resistance often becomes support, and vice versa.
The Core Idea Behind Law #3
Markets have “memory” because participants do. Traders and investors—human or algo—park orders and jump in or out at obvious landmarks.
The result: when price returns to a prior swing low, sometimes it bounces (support). At a prior swing high, sometimes it stalls and reverses (resistance). Think of it like a rubber ball: floors and ceilings can hold, until enough force (momentum) and mass (participation) drive a breakout.
Goal: Map the zones where decisions happen.
Look for Zones, Not Ticks
You’ll hear, “Watch support at $30.”
In practice, traders tend to act early, preempting a target level, or they act late, waiting to see what other traders and investors do. This turns a support level into a wider zone.
So, the main point: map the zone, not the tick.
Insider Tip: Mark the zone by shading recent swing highs and lows. The more touches without a break, the more resilient the zone, until it breaks.
Okay, enough description. Let’s take a look at an example.
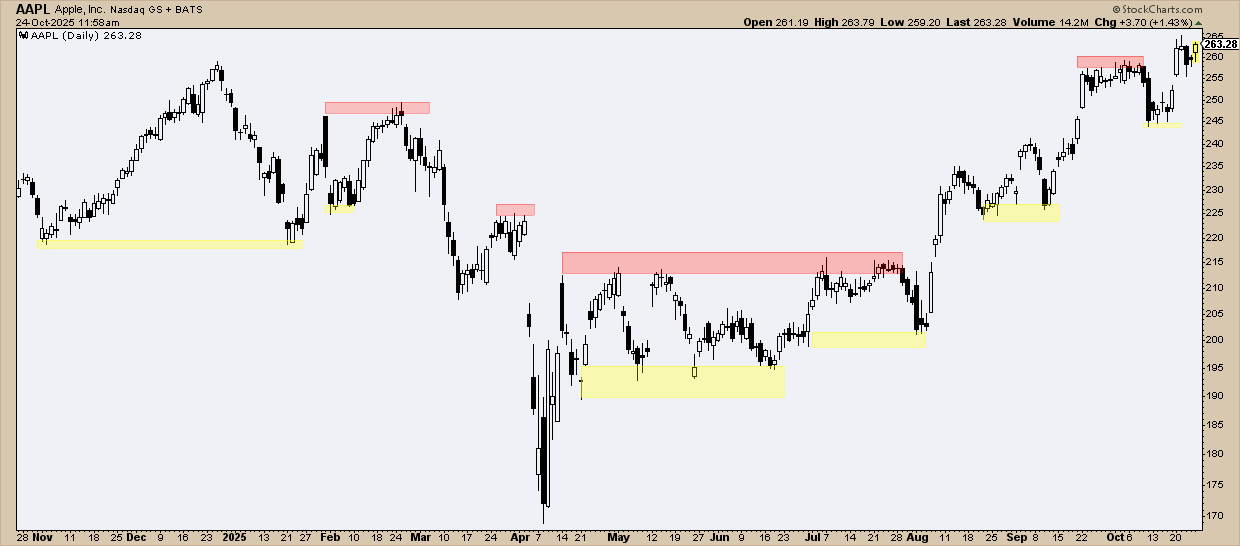
Here’s a daily chart of Apple, Inc. (AAPL). See the shaded areas?
- Support: See the yellow-shaded areas? Those are support zones. Notice how prices tend to bounce off them? Also, did you notice how the bounce occurs within a zone (and not a single level)?
- Resistance: You can see a similar dynamic in the red-shaded areas, marking resistance zones.
Now take a look at this chart of Sprouts Farmers Market (SFM).
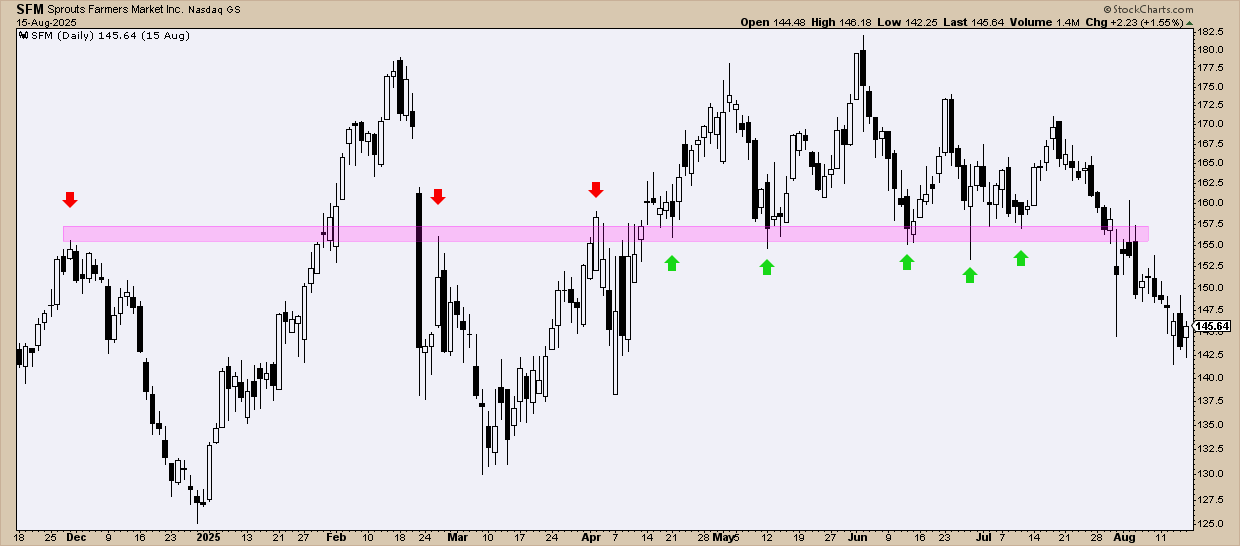
See how resistance (red arrows) turns into support (green)? That’s polarity in action. If you’re already in a trade and price pulls back, this level becomes your decision point: hold/add if it holds, cut or reassess if it breaks.
How Do I Apply Law #3?
Here’s how Law #3 applies across trending and non-trending conditions.
Uptrend Playbook
According to John Murphy, if you’re looking to buy or add positions, it’s best to do either near an anticipated support level. That could mean pre-empting a bounce at support; it could also mean waiting for the bounce and then opening your position.
- Look for either 1) previous support, or 2) a previous swing low, or 3) previous swing high (think: polarity) to anticipate support.
Watch out for this: If price breaks and closes below any of these support zones, the uptrend may be invalidated.
Downtrend Playbook
Conversely, it’s best to sell (to take profit or sell short) near a resistance level.
- Look for either 1) previous resistance, or 2) a previous swing high, or 3) a previous swing low (again, polarity) to anticipate resistance.
Watch out for this: If price breaks and closes above any of these resistance levels, the downtrend may no longer be valid.
Non-Trending Playbook (or just stay away)
When price chops between support and resistance, treat the edges with caution.
- Play the edges (optional): If you fade, buy support, or sell resistance, trade small and carefully place your stop losses.
- Respect the break: If price breaks beyond the range, assume a new trend and close out your trade.
- Think in zones: In ranges, support/resistance can expand. Stops set just above/below a single line often get nicked before price snaps back.
Insider Tip: Mark the range with rectangles. Place stops well outside the zone you’ve boxed to reduce whipsaw. Here’s what I’m talking about:
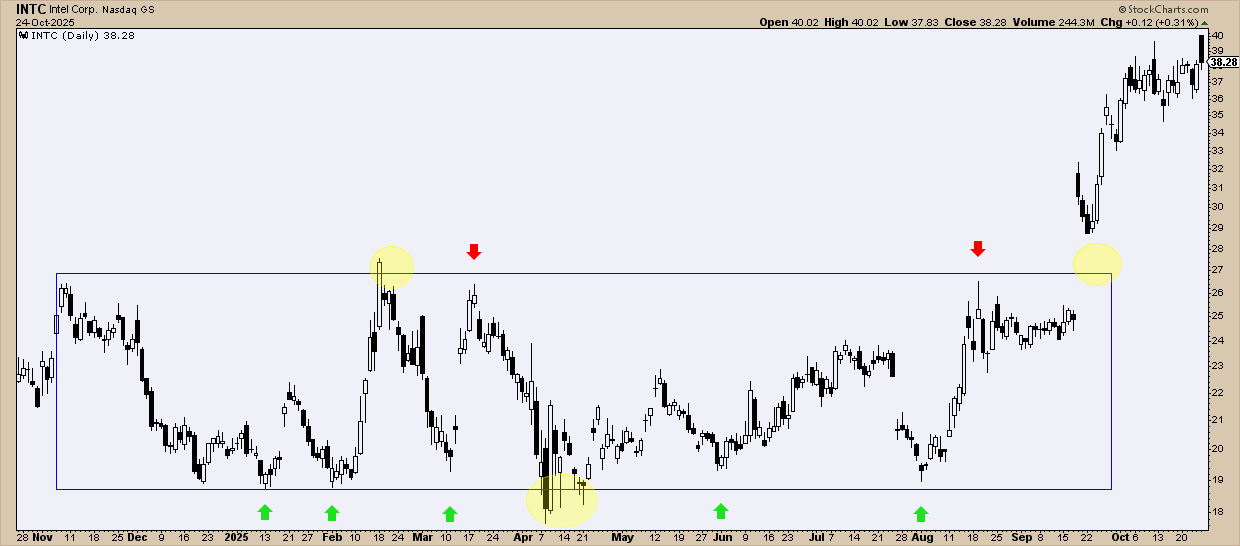
See this Intel Corp. (INTC) chart? Some traders might have attempted to buy near support (see green arrows) and sell at resistance (see red arrows).
But do you see those yellow circles? The same countertrend traders might have also been stopped out at any of these areas. And if any of them didn’t have a stop loss when prices broke above resistance on a gap in September, some might have woken up to a huge loss.
Are There Other Ways to Find Support and Resistance?
Yes, there are. We’re not going to cover these in depth right now, but here’s a list of other ways to find support and resistance beyond market levels (traditional support and resistance) and swing highs and lows:
- Trendlines
- Moving averages (like the 50-day and 200-day simple or exponential MAs)
- Fibonacci Retracements
- Bollinger Bands
- Ichimoku Cloud
That gives you plenty to start with. There are a few more, but I’ll leave you with these for now. We may even cover some of these topics at a later date.
Now, I want to go over a few rules of thumb that can help you with Law #3.
Rules of Thumb (Don't Ignore These)
- Support and resistance levels are often zones, not single price points.
- The more touches, the more important (or resilient) the level.
- If a resilient level breaks, expect a fast and strong move.
- Support and resistance zones that match on a weekly and daily timeframe will be much stronger than, say, smaller (and non-matching) support/resistance on an intraday chart.
- Volume confirms acceptance of a bounce or a breakout.
- Don’t buy into resistance or sell into support until a price breakout proves it.
- The first pullback into a freshly broken level is a polarity test.
Two More Insider Tips to Consider
Insider Tip: Anchor your levels to events. Might an anticipated support or resistance level bounce or break coincide with an earnings report, FOMC announcement, or any other major economic report? If so, you have to interpret the nuance in the price action. Also, remember that market memory is strong when it comes to event-driven reference points.
Insider Tip: Stack Confluence, Not Indicators. Does a given support level match a higher timeframe (daily and weekly), coincide with a Fibonacci level, moving average, or trendline? If so, that might make the level a critical one to keep an eye on.
And That’s a Wrap
Law #3 gives you the “where”, as in support and resistance levels are where important decisions and actions take place. Combine this with Laws #1 and #2, and you now have a practical framework for timing your entries and exits without having to overcomplicate your charts and, in turn, your decision-making.
This week, open up a few charts and try using different methods to locate support and resistance. Observe how prices reacted around these zones and try to imagine what you might have done to take advantage of the situation leading up to the market response.


