StockCharts Insider: John Murphy’s Law #4 - Know How Far to Backtrack (Retracements)
Before We Dive In…
They say “buy the dip.” You hear it everywhere. But let’s be honest—it’s a lot easier said than done. How deep will the dip go before the trend resumes (if it resumes at all)? Where’s the bounce hiding, and why there?
A lot of forecasters try to guess these levels using fundamentals. Not the smartest move, since it ignores what traders actually do. And just what do traders do? That’s what John Murphy’s Law #4 is all about. It’s the law of the “giveback”: how to measure it, how to trade it, and how to spot when the bounce might be worth a shot.
Interestingly, it all goes back to an Italian mathematician from the 1200s.
What’s the Core Idea Behind Law #4?
You’ve probably heard pundits say the market is “taking a breather” when prices pull back. It’s a nice metaphor.
But how might you position yourself to catch the next leg up before it decides it’s done taking its break? And how do you know you’re not catching a falling knife? Well, you simply measure it.
Let's start by checking out the Apple Inc. (AAPL) chart below.
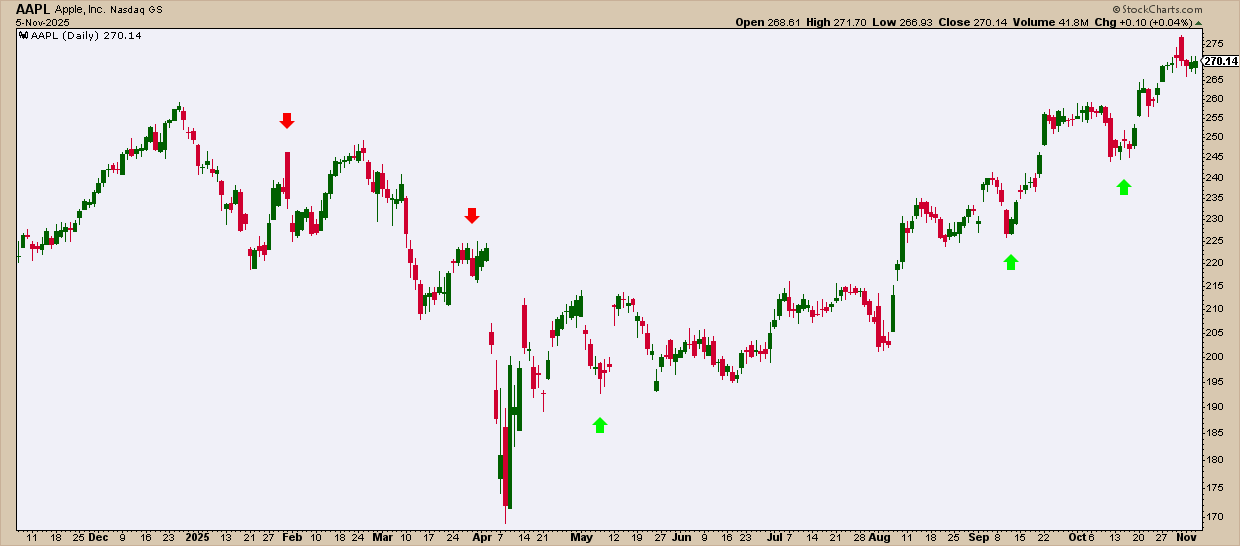
When price pulls back and then reverses to continue its main direction, that reversal may have been caused by a number of things. Maybe it’s previous highs or lows, a moving average, a trendline, channel, or band. That’s where measurement tools come in. One favorite among traders—as it helps quantify the depth of a pullback—is the Fibonacci Retracement.
Take a look at the red and green arrows on the chart above. Ask yourself: why there? Was it a previous support and resistance area? It’s quite possible.
Alternately, were traders looking to see if AAPL’s pullback (up or down) reached the key Fib levels of 38.2%, 50%, and 61.8%? Well, look at it again.
Notice how sellers (red arrow) and then buyers (green arrow) jump in once a pullback reaches one of these key Fib levels. It’s likely many traders anticipated that bounce before price even got there.
The main point here is that you can, too—if you learn how to plot Fib retracement levels.
Wait…Why Do Traders React to 38.2%, 50%, and 61.8%?
I know what you’re thinking. Surely, these can’t be magic numbers. There has to be some logic to them right?
Here’s the skinny: These levels sit where lots of traders agree to potentially jump in, so orders are clustered there. Add some trading psychology and what you end up with are not magic numbers but legit reaction zones.
- 38.2% - the shallow test: In a healthy trend, the first few pullback sessions don’t give you a half-off sale, but bullish dip buyers (or bearish sellers, in a downtrend) are confident enough to prove their case early by jumping in. For most traders, however, it's a reversal alert zone. They’re ready to jump in if the early buyers make a strong move.
- 50% - a tense equilibrium (not a Fibonacci ratio, but traders love it): Old-school tape readers treat the halfway mark as a “fair fight.” Imagine a pullback from an uptrend. The bulls are still profitable, but the bears who sold short at the top are equally profitable. It’s like a tense equilibrium. One side is going to blink.
- 61.8% — “last line of defense” (golden ratio): Go deeper than half and you’ll get to the golden-ratio retrace. Many trend traders see this as the final place to buy a pullback before conceding to the opposite side and closing their position. That tension around 61.8% (open a position at or above, and close out position or reverse below) concentrates a lot of orders at that level.
So, there you have it. There’s no magic. Just human psychology and trading mechanics.
Try It Yourself
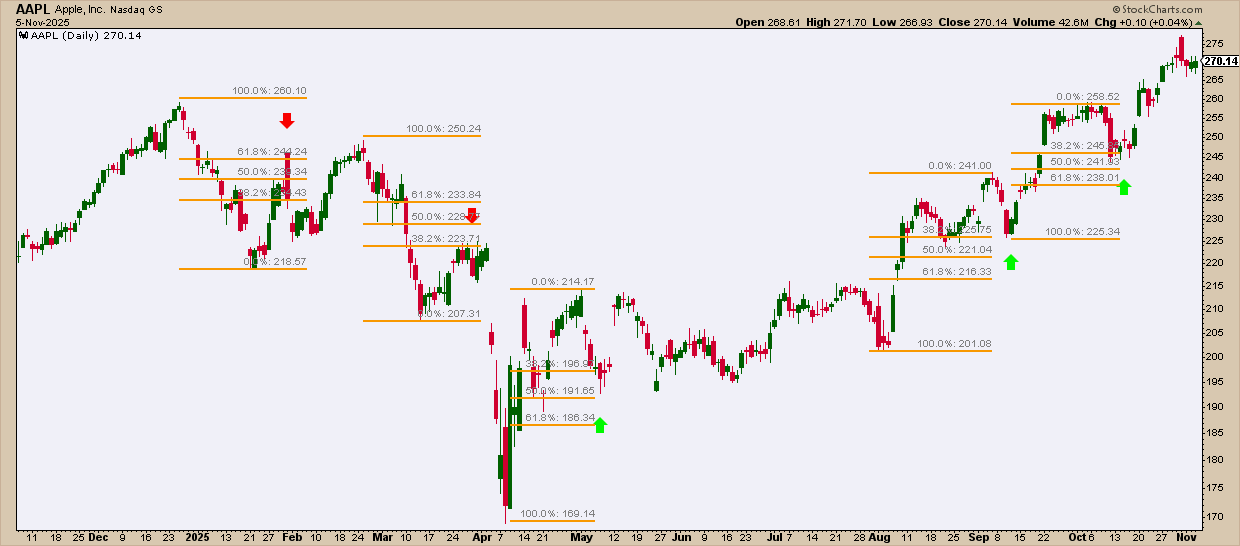
- Identify a Pullback: Find a clear swing low to high (in an uptrend) or reverse in a downtrend, and a pullback.
- Measure the Move: Using StockCharts’ Fibonacci Retracement tool, measure the move from low to high (in an uptrend) or high to low (in a downtrend).
- Watch Price Behavior: Take note of what happened (or, if current, watch what happens) at the key levels of 38.2%, 50%, and 61.8%.
If you enter a position once price bounces at one of the key levels, placing a stop beyond the 61.8% level would be a wise thing to do in most cases. Look at market structure for support and resistance to fine-tune your stop level.
A Few Insider Tips
Fibonacci retracements are simple enough to use—find the right swings and measure them. But a few smart tweaks can supercharge your Fib game:
Insider Tip #1: Watch for Confluence: Key Fib levels are compelling enough for traders to take action. But if those levels coincide with a prior swing point or a trendline, that Fib level matters even more.
Insider Tip #2: Avoid “precision bias”: Traders react to zones, not exact numbers. So don’t sweat it if price action pops a little above or below your Fib level. That’s normal.
Insider Tip #3: Watch volume on the bounce: Volume can confirm commitment, so a surge in volume near a key retracement level can signal renewed interest.
Wait, You Mentioned a 13th Century Mathematician
That’s right, I did. Before we call it a wrap, let’s give credit where it’s due: Leonardo Fibonacci, a 13th-century math guy, “rediscovered” a number sequence that’s still relevant today—1, 1, 2, 3, 5, 8, 13, 21, 34... you get the idea; each number the sum of the two before it.
After the first few numbers, each one settles at about 0.618 of the next. Ancient Greek mathematicians like Euclid described that proportion as the “extreme and mean ratio.” Centuries later, it became known as the Golden Ratio—a pattern often linked to art, architecture, and nature. Interestingly, traders use it to measure retracements and map out potential entries and exits, among other things.
And That’s a Wrap
Law #4 gives you an actionable measuring stick for market corrections. It helps you spot objective entry zones instead of guessing whether a pullback is deep enough for a discount.
Most importantly, it helps you avoid catching falling knives. And if you do catch one, it shows you how to limit the cut. You’ll know where to step in, where to step out, and when to stop hoping and start managing.
Once you’ve got that down, you’re ready for Law #5—drawing the trendlines that connect it all together.


