StockCharts Insider: John Murphy’s Law #6 — Follow That Average (Moving Averages)
Before We Dive In…
If trends are like the market’s storyline, then moving averages are the narrator that keeps the story straight. It smooths out the noise, revealing the market’s direction, and showing whether the trend narrative is strengthening, weakening, or just stuck. Welcome to John Murphy’s Law #6: follow the moving average.
The Core Idea Behind Law #6
A moving average (MA) smooths out recent prices to show which way money is really flowing. No headline noise. No jerky movements. Just the trend, averaged out and distilled into a single line.
Sometimes that trend is moving upward, downward, or oscillating sideways in a choppy manner. A key point to bear in mind: Moving averages don’t predict. They confirm.
They lag price action, so they can’t really tell you much about what’s happening now, at this moment. However, they can help you see whether a trend is gaining steam or about to flatline.
Think of moving averages as waves created by price. When price rides above the wave, that’s bullish. When it dips below, the wave’s momentum can shift depending on what price does next. The reverse is true when the trend is downward.
Three Averages That Matter Most (according to Murphy)
Murphy calls out the big three, and they’re pretty much industry standards:
- 20-day 🠊 short-term trend
- 50-day 🠊 intermediate trend
- 200-day 🠊 major trend
You’ll see these combined in many chart settings. Everyone watches them. Let’s take a look at a chart using this setting to see how it “narrates” the story. And for our purposes, I'm going to use Simple Moving Averages (SMAs).

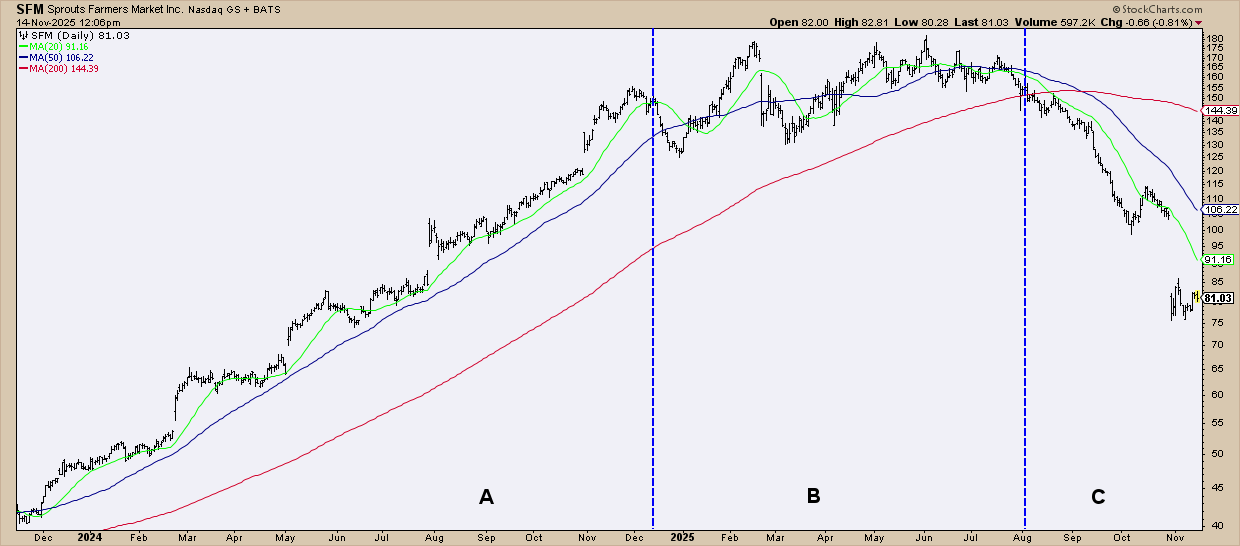
FIGURE 1. DAILY CHART OF SPROUTS FARMERS MARKET (SFM). Notice how the three moving averages tell a different story in each section of the chart.
A - Strong Trend: The 20-, 50-, and 200-day SMAs are stacked in perfect bullish order and pulling upward like full sails. Price may wiggle around the 20-day, but it’s essentially surfing the 50-day. That’s classic strong-trend behavior.
B - Trend Goes Sideways: Now we’re in chop city. Momentum stalls and price settles into a sideways fight between buyers and sellers. The 20-day SMA starts whipping above and below the 50-day as consolidation tightens. The 200-day still slopes upward, until price finally slips beneath all three SMAs.
C - Trend Reversal: Price breaks down hard, dragging all three SMAs into bearish alignment (20 below 50 below 200). When the 50-day drops under the 200-day, you get a Death Cross—a classic confirmation that the trend has flipped. It’s the mirror image of the bullish setup you saw in section A.
Now, you’ve seen these MA combinations in a bullish, sideways, and bearish market scenario. You’re probably wondering what other ways to apply them in your charting or trading. Let’s get to that next.
How to Actually Use Moving Averages
Let’s get specific. Here are a few basic ways traders use moving averages.
1 - Gauge Trend Strength
- Rising price above a rising average 🠊 uptrend intact
- Falling price below a falling average 🠊 downtrend intact
- Slicing back and forth through a “flat” average 🠊 range, consolidation, indecision
Note: Alignment between price and MA direction is often a stronger single than just price or MA alone.
2 - Trade Pullbacks Into the Moving Average
This is one of the simplest uses of an MA, but there are many variations and nuances to this. For instance, some traders like to use the 100-day or 200-day SMA, depending on their time frame. Others would rather use the exponential moving average (EMA) rather than the SMA.
So, be sure to experiment with your approach before trying it in a real market.
Uptrend:
- Buy dips toward the 50-day (or 100, or 200) MA.
- Confirmation = good bounce + strong volume.
Downtrend:
- Sell rallies into falling MAs.
- Confirmation = rejection candle (or bar) + declining volume on the bounce.
Again, there are many other tactical variations to this, so be sure to learn about them to find what best suits your approach.
3 - Watch for MA Crossovers
You’ve heard the term Golden Cross (bullish) and Death Cross (bearish) involving the 50-day and 200-day MAs.
Breaking these down to simpler terms, this is essentially what they indicate:
- Bullish: short MA crosses above long MA
- Bearish: short MA crosses below long MA
These are crossovers, and there are many popular combinations you can try:
- 5/20 - for faster action
- 20/50 - for swing traders
- 50/200 - for a longer-term signal
As John Murphy says, exponential moving averages (EMAs) are usually more suitable for spotting moving average crossings.
Also, crossovers may not be used to nail bottoms or tops, but they do a great job confirming shifts in trend strength. Take a look at the example below.

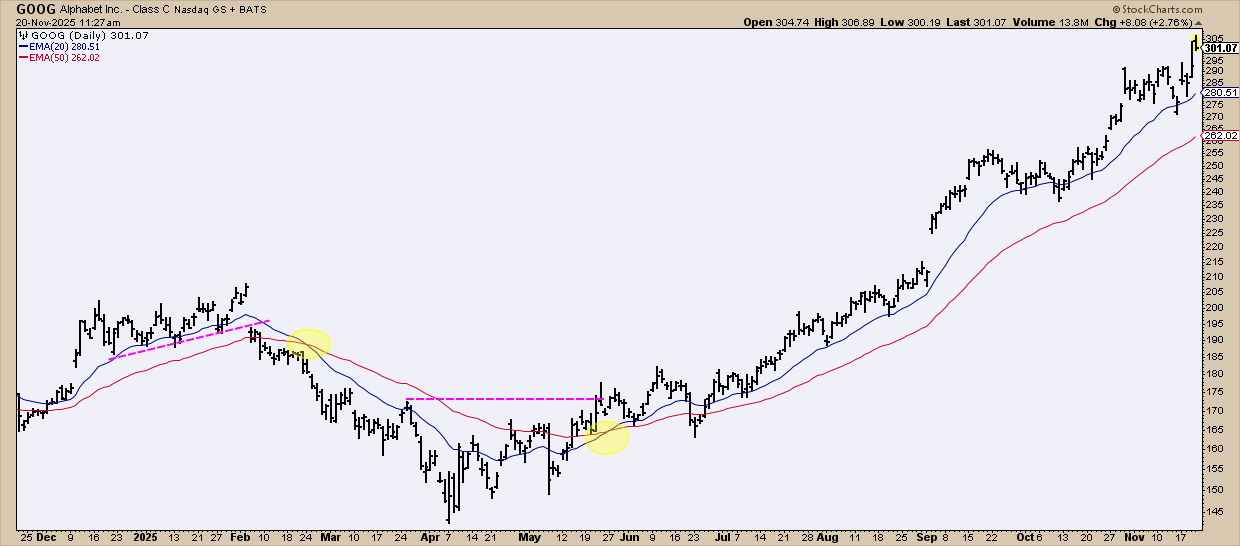
FIGURE 2. DAILY CHART OF GOOGLE (GOOG). This shows the price action from a perspective using the 20-day and 50-day EMA.
February wasn’t the best month for GOOG. It gapped down hard, sliced through its trendline (dotted magenta line), and basically said, “This uptrend? I’m out.” A few days later, the 20-day EMA dipped under the 50-day EMA, which is the chart’s polite way of saying, “Yeah, the downtrend is official.”
But sentiment shifted in April. Price stopped falling, moved sideways, and quietly started making higher lows. Then came May, when GOOG finally punched through a key swing high, giving us its first legitimate higher high. Add a bullish EMA crossover, and the reversal became loud and clear.
After that, GOOG soared. Price stayed largely above the 20-day EMA, and the gap between the 20- and 50-day EMAs started stretching “full sail,” indicating that the trend was gaining speed.
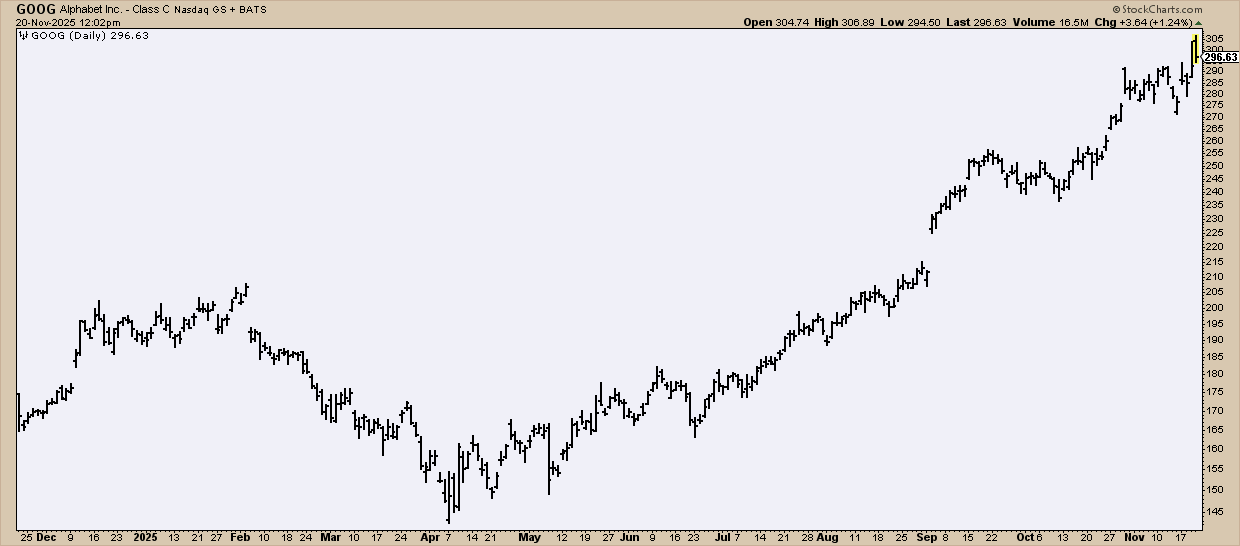
Now, look at the same chart without the EMAs.

FIGURE 3. DAILY CHART OF GOOGLE (GOOG) WITHOUT THE INDICATORS. Compare this to the previous chart and note the difference in your perception of the price action.
Would you have seen those subtleties without the moving averages? Probably not.
This is exactly what Murphy means by letting the averages “show you” when the trend is changing.
Two Insider Tips to Level This Up
Moving averages are quite straightforward, but using them well often means taking a nuanced approach. Here are just a few to consider.
Insider Tip #1 — The Slope Sometimes Matters More Than the Crossing
Flat moving averages usually mean the market’s unsure. A rising MA slope, even if price dips under it for a moment, might hint that the bigger trend is still intact. A falling slope says the opposite, even if price briefly pokes above it.
Remember, moving averages lag. So your job is to judge whether a price touch or quick cross is just a pullback or the start of a real trend change. That’s where context comes in: trend structure, volume, and where price sits relative to recent swing points.
In other words: don’t fixate on every tiny cross. Sometimes the slope tells you more than the actual crossover.
Insider Tip #2 — EMAs for Speed, SMAs for Stability
EMAs weight recent data more heavily. That makes them faster, more responsive, and possibly better for short-term traders. They tend to give earlier signals—but treat those with caution, because early signals can sometimes be fake-outs.
SMAs tend to be slightly slower, smoother, and less whippy. For a longer-term perspective on trend structure, SMAs might be more suitable (again, depending on the price action).
- If you take quicker, shorter-term trades, try EMAs.
- If you want less noise, stick to SMAs.
A Few More Things to Consider
You’ll see plenty of traders treat pullbacks to the 50-day MA as buyable dips. It’s almost a rule of thumb. Just remember: it’s not a magic line. The setup still depends on context; and yes, the slope of that 50-day matters.
You’ll also notice that the 200-day MA is like an institutional line in the sand. Yes, institutions watch it like hawks. The old market saying, “nothing good happens below the 200-day,” exists for a reason. But again, it’s not a standalone verdict. Pair it with price structure, momentum, and volume to understand what’s really happening.
Try This Yourself
This week, pull up your favorite chart and toggle the 20/50/200-day moving averages. Try using SMAs and then EMAs. Watch how differently you interpret the trend or trend strength.
Soon, you’ll figure out which one to use and how best to use them in a way that aligns with your own personal charting approach.
And That’s a Wrap
Moving averages aren’t predictive indicators, but, if used correctly, they can help keep you on the right side of the trend. Use them to filter the noise, spot momentum shifts, and confirm what price action may be doing. MAs provide a certain angle of context to help keep your chart interpretations grounded. Try experimenting with them and, eventually, customize them to match your style.


