StockCharts Insider: John Murphy’s Law #7 — Learn the Turns (Oscillators)
Before We Dive In…
Even when markets trend in a given direction, they still fluctuate. It’s as if price overshoots in one direction, stalls, snaps back, and continues in the same primary direction. These are like mini-cycles within a broad trend. And detecting these mini-cycles is where oscillators shine. So, while moving averages may tell you that a trend is still strong, oscillators hint at when a trend is getting “tired” and bent on taking a breather, or bound for a larger reversal.
There are opportunities in these turning points. And Law #7 in John Murphy’s playbook is all about spotting them before price commits. Let’s break down how, and when, to use them.
Why Do Oscillators Matter?
Oscillators are designed for one thing: to show you when momentum may be pushing its limits.
Traders have found other purposes for them, but, really, that’s what they’re designed to do. More specifically, they tell you when a market may be:
- Overbought—when buyers are losing steam
- Oversold—when sellers may be reaching burnout
- Diverging—when momentum disagrees with price’s trajectory
- Flattening—when prices are sideways or range-bound
These are all in the domain of oscillators as most other indicators are either less effective or blindfolded when it comes to these potential turning points.
The Two Stars of the Show: RSI and Stochastics
The Relative Strength Index (RSI) and the Stochastic Oscillator are two that Murphy highlights because they’re generally effective, easy to read, and widely used.
If you’re new to them, here’s the quick rundown of what makes each one tick.
But a quick heads-up: What follows are the classic interpretations which, of course, are absolutely useful most of the time. But like any indicator, the nuances matter—so don’t treat them as automatic buy/sell signals.
Relative Strength Index (RSI)
Scale: It goes from 0–100
Classic zones:
- 70+ = Overbought
- 30– = Oversold
Best perks:
- Divergences (momentum disagrees with price)
- Failure swings (RSI turns before price does)
- Trend ranges (RSI behaves differently in bull vs. bear markets)
RSI is like minimalist design: it gives clear and clean signals that can often seem understated.
For example, take the failure swing in the chart below.
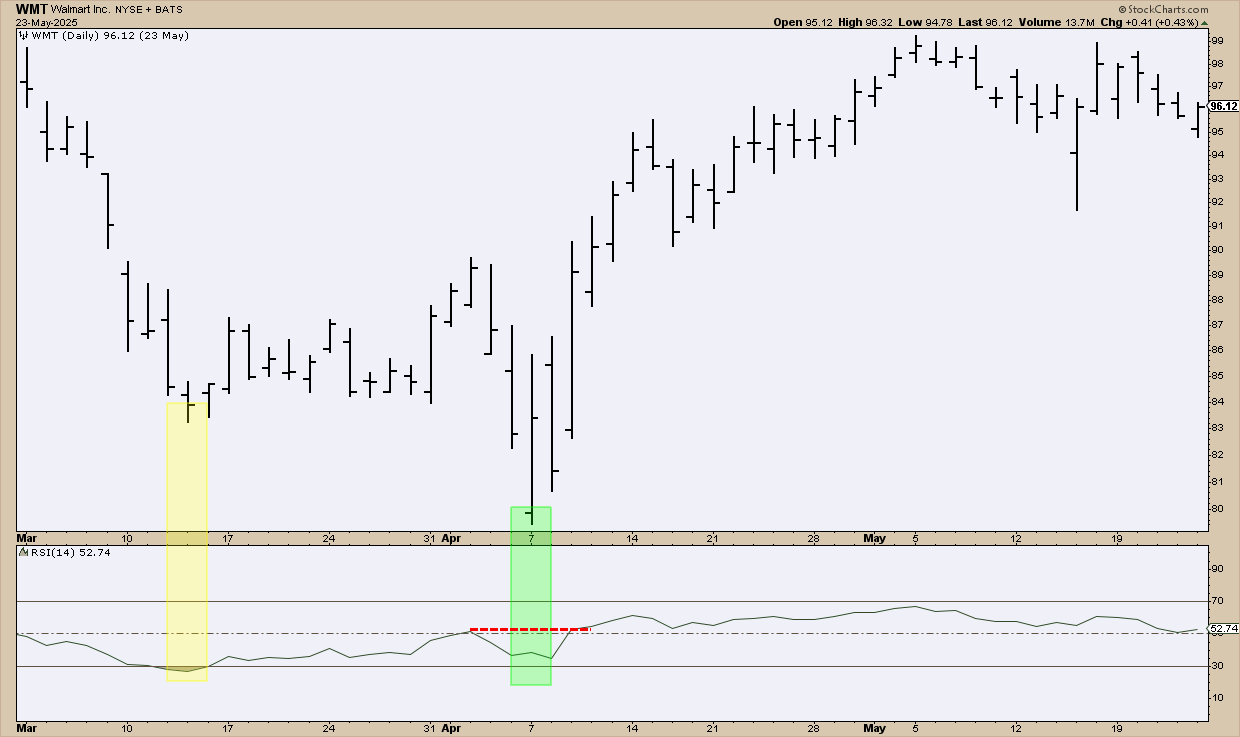
FIGURE 1. DAILY CHART OF WALMART. The shaded areas illustrate a failure swing.
The yellow-shaded area shows RSI dipping below 30 (an oversold low) and then bouncing back. A few weeks later, WMT makes an even lower price low, but RSI doesn’t. Instead, RSI holds above 30 and forms a higher low. That’s your failure swing setup.
A few sessions later, RSI clears its previous peak (the red breakout line), confirming the failure swing and signaling that momentum has shifted.
Stochastic Oscillator (%K / %D)
Scale: 0–100
Uses closing price relative to the recent high-low range
Classic zones:
- 80+ = Overbought
- 20– = Oversold
Best perks:
- Very fast signals
- Excellent for trading ranges
- Divergences and bull or bear “set-ups”
Stochastics react earlier than RSI, sometimes too early.
You know the eager person in the office who always has a hunch? That’s like the stochastic oscillator: sometimes brilliant; sometimes annoying.
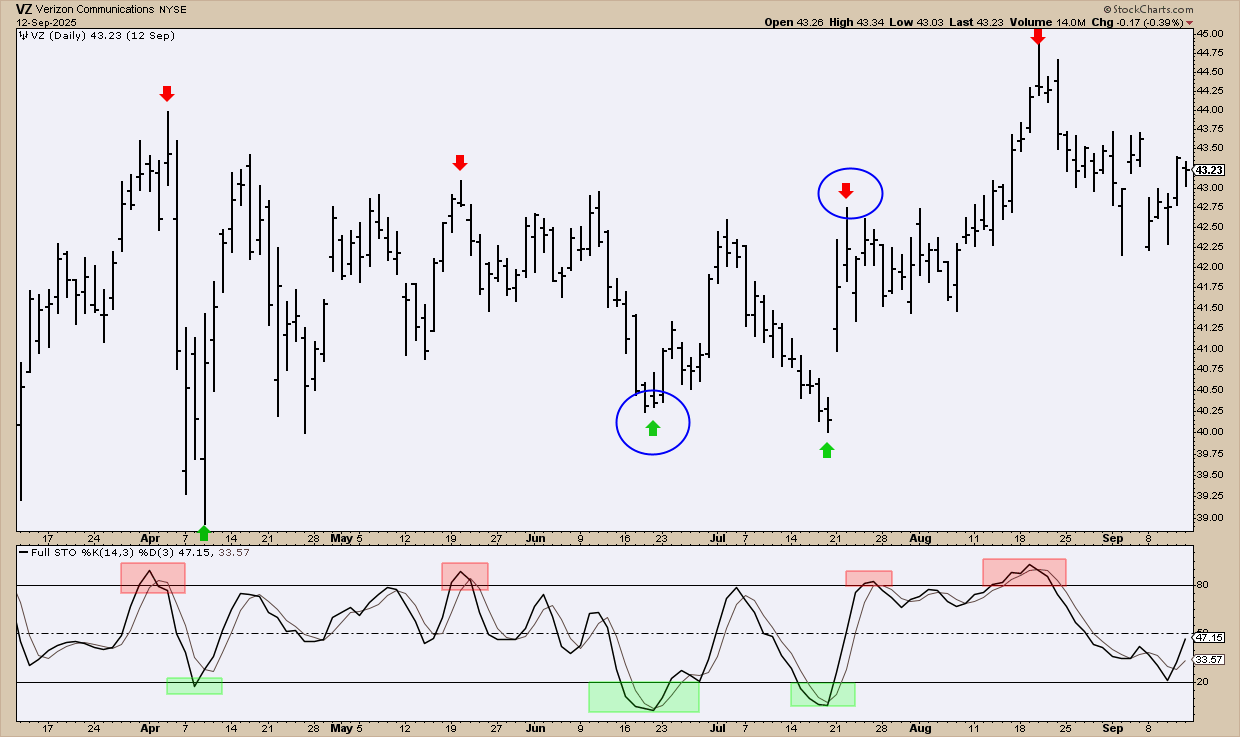
FIGURE 2, DAILY CHART OF VERIZON. This wide trading range is a suitable environment for the stochastic oscillator. But it isn’t perfect, as I explain below.
This Verizon (VZ) chart shows a wide trading range—a perfect environment for one of Stochastics’ classic uses. Overbought zones are shaded red, oversold zones in green. The red (sell) and green (buy) arrows line up with those stochastic levels.
But trading ranges can be messy. Prices often poke above prior highs or slip below prior lows before reversing. That’s why the signals circled in blue are important. Depending on how you managed them, they could’ve turned into wins, breakevens, or even losses.
The Actual Signal: Momentum Turns Before Price
These indicators contain a ton of information — more than we can cover in one section.
So let’s zero in on the purpose Murphy cares about most. This is the heart of Law #7.
Murphy’s core point is simple: trend changes almost never begin with price. They begin with momentum weakening first.
Oscillators tend to post this early on.
Here’s the typical reversal sequence:
- RSI/Stochastics hit extreme levels
- Momentum starts fading
- Divergence shows up
- Price finally cracks (or breaks out)
If you wait until Step 4, you’re late.
Using These Oscillators the Smart Way
1 - Always Start with the Bigger Trend
Oscillators tend to give you more false positives when you force them to call tops and bottoms. If you’ve done this before, you probably know what I’m talking about. Listen to what they’re saying but don’t force them to speak. It’s all about nuance in interpretation.
- In an Uptrend: Give more trust to oversold readings (ignore overbought noise)
- In a Downtrend: Trust overbought readings (ignore oversold noise)
- In a Range-bound market: Trust both
Follow this one rule and you’ll prevent around 80% of oscillator-related headaches.
2 - Look for Divergences
When price hits a new high but the oscillator hits a lower high 🠊 momentum may be fading.
When price hits a new low but the oscillator hits a higher low 🠊 sellers may be tiring.
Treat these as your “this might not last” signals and be ready to seize the opportunity when price turns.
3 - Watch for Failure Swings
Murphy emphasized these because they’re self-contained signals.
- A bullish failure swing: RSI drops below 30 🠊 rises 🠊 pulls back 🠊 stops above 30 🠊 surges past prior high.
- A bearish failure swing: RSI rises above 70 🠊 falls 🠊 rises again 🠊 stops below 70 🠊 falls below prior low.
In either case, it shows internal strength (or weakness) building before price confirms it.
NOTE: There’s so much more to both so please read their ChartSchool articles to get a broader understanding of the various applications.
This of Oscillators As An Early-Warning System
Here’s a neat way to think about this: If moving averages are your “trend compass,” these oscillators are your “turn detectors.”
If you read them correctly, they can help you:
- Anticipate potential reversals early on
- Avoid chasing moves that are over-stretched
- Time entries in pullbacks
- Trade ranges more effectively
Here’s Murphy’s subtext: Oscillators show you when the market is about to take a breather. Sometimes, the trend will continue, and sometimes, it will reverse. Either way, the RSI or Stochastic Oscillator will signal the move before it happens.
And That’s a Wrap
These oscillators won’t predict the longer-term direction, but they do hint at a momentary turn. That alone can signal an opportunity to go long or short. If you can learn to spot weakening momentum early, you’ll understand why Murphy treats these oscillators as one of the most important tools in the kit.


