StockCharts Insider: John Murphy’s Law #8 — Know the Warning Signs (MACD)
Before We Dive In…
Markets don’t usually flip the other direction in one sure and sudden move. More often than not, they telegraph their intentions first. After that, momentum cools, trends soften, and the signals start blinking before the actual turn hits.
John Murphy’s Law #8 is about spotting those early shifts. And for that, he leans on the MACD — the Moving Average Convergence/Divergence oscillator. Most traders simply call it ‘Mac-D.’
Think of MACD as the dashboard light that flips on when the engine’s running hot. The trend might look fine, but the MACD is often the first to say, “Something’s changing.”
What’s the Core Idea Behind Law #8?
Law #8 is all about using the MACD to detect subtle shifts that often precede a larger trend change.
How does that work? The MACD takes two trend-following indicators—the 12-day EMA and the 26-day EMA—and basically transforms them into a momentum oscillator:
- MACD Line: 12-day EMA – 26-day EMA
- Signal Line: 9-day EMA of MACD
- Histogram: MACD – Signal Line
Combined, the oscillator shows you whether strength is increasing, decreasing, or starting to slip in the opposite direction.
Most importantly: MACD often turns before price does. And perhaps that’s why Murphy has elevated this single tool into an entire law.
MACD’s Three Warning Signs
There are three general warning signs that the MACD generates. Each one’s a little different, so I’ll walk you through them, from earliest to strongest.
Warning Sign #1: Momentum Flip (Signal Line Crossovers)
The most common alert is the signal line crossover:
- Bullish warning: MACD turns up and crosses above the signal line.
- Bearish warning: MACD turns down and crosses below the signal line.
Check out these signals in the chart below.
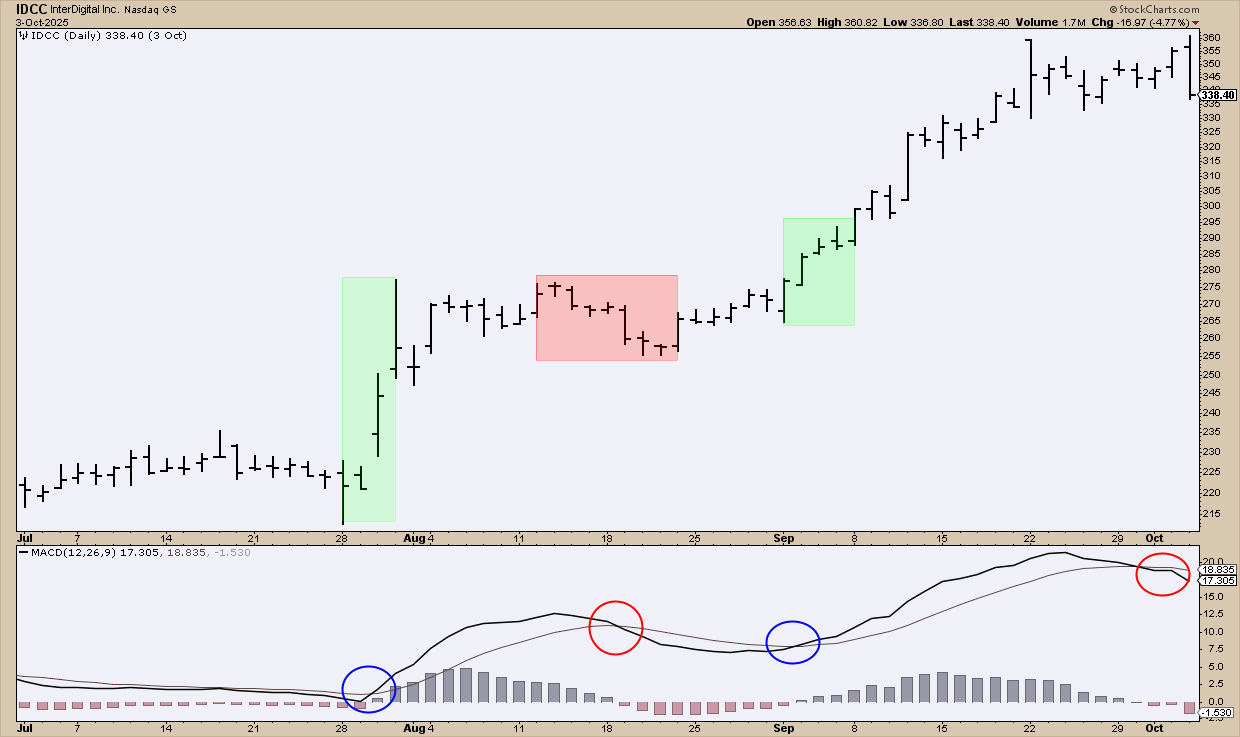
FIGURE 1. DAILY CHART OF INTERDIGITAL INC (IDCC). What do the crossovers tell you about the price action?
Now, to better understand what’s going on, here are a few more nuances to consider:
- A bullish crossover below zero while price is declining warns that bearish momentum is fading.
- A bearish crossover above zero while price is rising warns that bullish momentum is weakening.
- BE CAREFUL: Crossovers at extremes can be misleading, as momentum slows after big moves.
In this chart, the MACD spends all its time above the zero line, so compare the principles above with what’s going on in the chart. Now, does it make more sense?
In the case of the bearish crossovers, can you see how they serve as a “yellow light.” They’re not major reversals yet, but notice how they warn that something is shifting, in this case, toward weakness.
Warning Sign #2: Trend Shift (Centerline Crossovers)
Pay attention to the centerline designated zero. Now, where is the MACD in relation to that centerline?
- Above zero indicates that the momentum is turning positive.
- Below zero suggests that momentum is turning negative.
Momentum flipping sides is among the strongest trend-warnings you can get from MACD.
Centerline crossovers warn of big shifts:
- In strong trends, they can last months.
- But in choppy markets, they can chop you to pieces.
Murphy’s framing: Use centerline crossovers to recognize when a prevailing trend is losing strength—or reversing entirely.
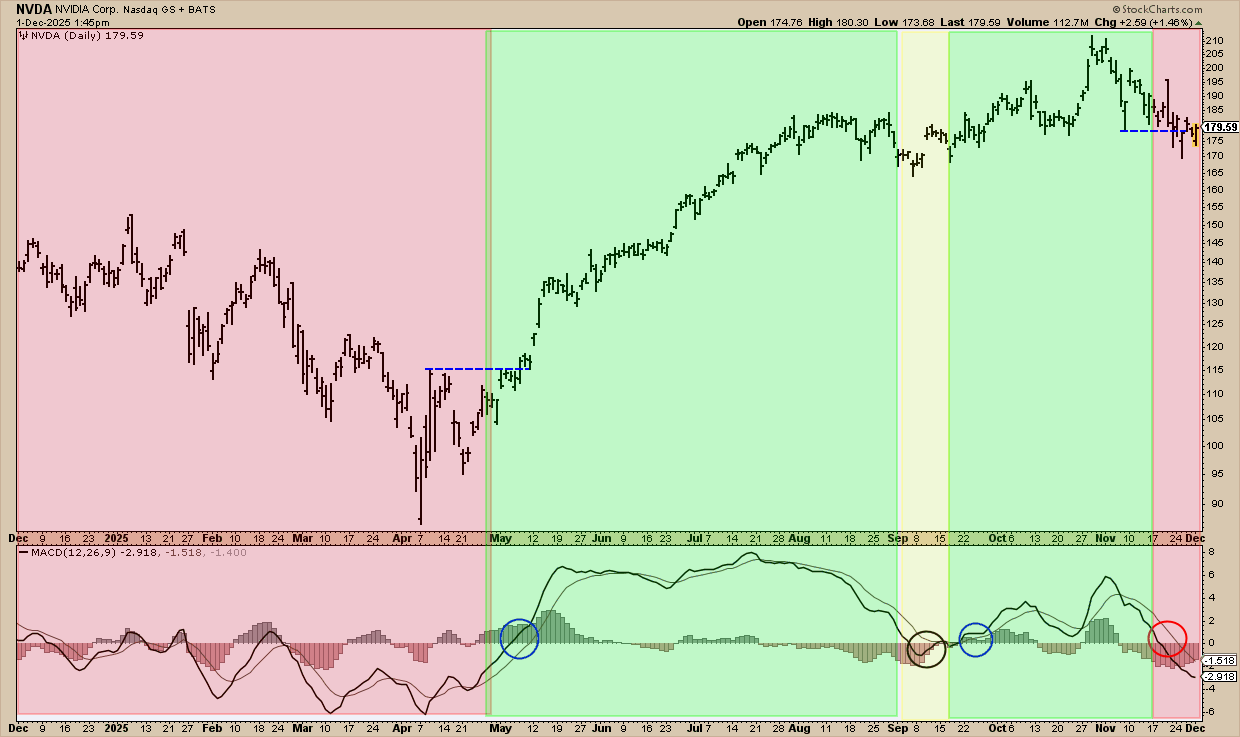
FIGURE 2. DAILY CHART OF NVIDIA (NVDA). The color coding indicates the position of the MACD relative to the centerline.
Red shading marks when both the MACD and signal line are below the centerline. Green shows when both are above it. The yellow zone highlights a transition phase. In this case, the MACD slipped below zero but the signal line didn’t. Crossovers are circled (blue = bullish, red = bearish).
The breakouts (blue lines) confirm that momentum has shifted. In other words, don’t just trust the MACD signal alone. Use price structure.
Just take a moment to observe how price reacts to these shifts. See how the MACD’s position relative to the centerline tracks momentum versus the broader trend? Here’s the quick takeaway: when both lines are above zero, the bullish side usually prevails. When both are below zero, bearish pressure tends to rule.
In short, the crossover signals that momentum has officially changed lanes.
Warning Sign #3: Divergences (Momentum Disagrees With Price)
This is a classic signal for which the MACD is well known. Here’s how it works:
- A bullish divergence forms when price makes a lower low yet the MACD makes a higher low.
- A bearish divergence forms when price makes a higher high yet the MACD makes a lower high.
Divergences warn you that price is no longer supported by momentum. In other words, price is still moving in the direction it’s been heading, but it may be weakening.
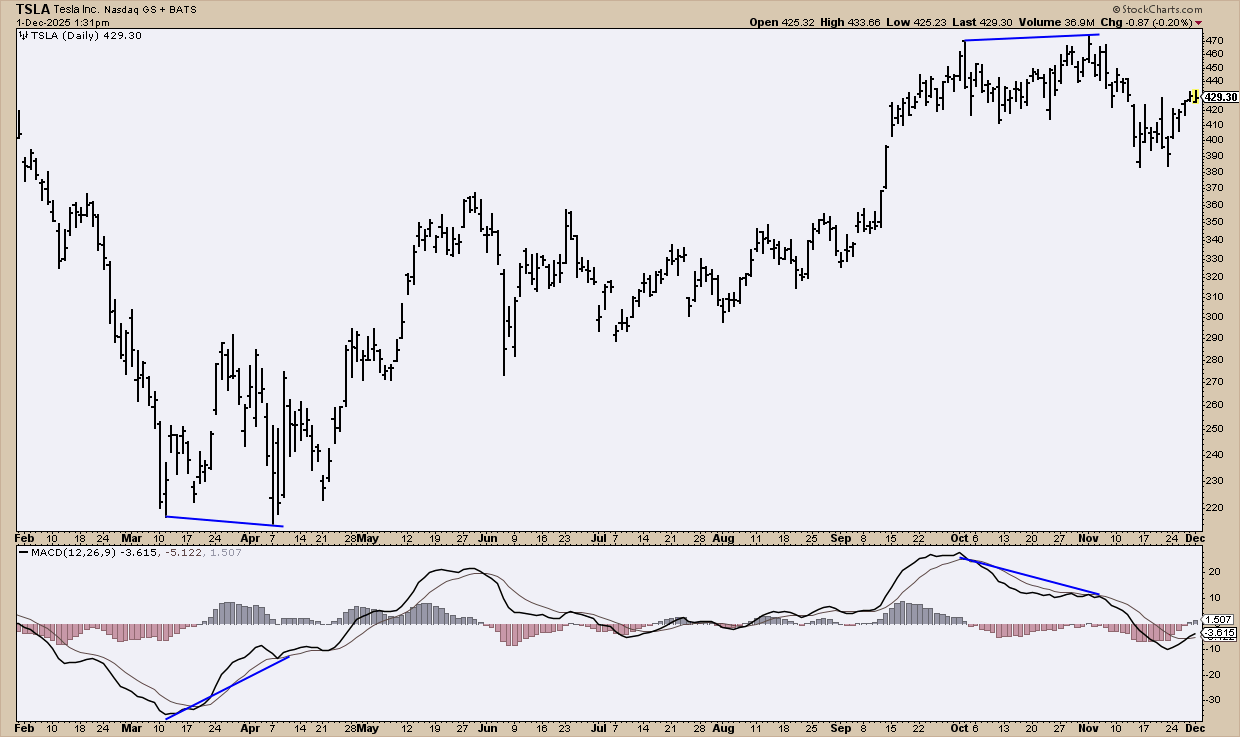
FIGURE 3. DAILY CHART OF TESLA (TSLA). Note the divergences highlighted by the blue trend lines.
The divergences on the price end may be subtle, but those on the MACD are quite pronounced. Can you see it? What followed is a classic example—a rally after a bullish divergence, and a fall after a bearish divergence.
Important: Divergences are warnings, not predictions. Even if they’re often consistent, never assume that the expected outcome is definite.
That’s a lot of info. So, is there a way to boil this down to a simple checklist? Let’s give it a shot.
The MACD Warning System Checklist, Murphy-Style
Remember the basic principle: MACD warns. Price confirms.
1. Check the Histogram First: The shrinking bars warn that momentum is fading before the lines cross.
2. Watch the Signal Line: Crossovers warn of potential turns in momentum. Where it takes place—above or below zero—tells you how strong the warning is.
3. Watch the Centerline: Centerline crossovers often warn that trend momentum has flipped (we saw this in example 2 above).
4. Hunt for Divergences: Divergences explicitly show you that price and momentum (its main driver) went separate ways.
5. Always Confirm with Price Structure: Warnings become signals only when price agrees:
- Breaks of support/resistance
- Trendline breaks
- Failed retests
- Volume confirmation
Once again, MACD warns, but price confirms.
And That’s a Wrap
The MACD is your early-warning system. It diagnoses trend health, flags momentum shifts, and, if used carefully, helps you spot entries and exits. Trends don’t last forever, and price can continue driving forward even as momentum fades. These are the kinds of changes the MACD was designed to catch.
So pull up a chart, turn on the MACD, and start watching how momentum behaves before price tips its hand.


