StockCharts Insider: John Murphy’s Law #9 — Trend or Not a Trend (Using ADX)
Before We Dive In…
Is the market trending right now, or is it chopping sideways? More importantly, should you be riding a trend, trading a range, or standing aside altogether? There may be many ways to figure this out, but John Murphy leans on one tool in particular: the Average Directional Movement Index line, which is an isolated component of the broader Average Directional Movement Index (ADX).
We’ll focus solely on the ADX and use it the way Murphy suggests in Law #9: to follow its slope to better separate trends from sideways chop.
What’s the Core Idea Behind Law #9?
Law #9 is about using the ADX (Average Directional Index) as a trend detector. In other words, use it to determine whether price is in a trending phase or a trading range.
Murphy’s take is slightly different from the way Welles Wilder (the ADX’s developer) approaches it:
It’s not whether ADX is high or low that matters most (we’ll address this later on)—it’s whether the ADX is rising or falling.
- Rising ADX 🠊 a trend is strengthening
- Falling ADX 🠊 a trend is weakening or disappearing
That simple slope, up or down, tells you which style of trading makes sense right now.
And you can probably guess…
- If it’s trending, you want to follow the trend.
- If it’s going sideways, you want to either stay away or, if you’re experienced enough, fade the tops and bottoms, taking a mean-reversion approach.
Where the ADX Comes From (Quick Context)
The ADX is derived from two directional indicators: +DI (upward pressure) and –DI (downward pressure). Those two show direction.
Now, the ADX itself doesn’t care about direction at all. It only answers one question: How strong is this trend? If the ADX is rising, the trend is gaining force. If it’s falling, the trend is losing steam.
Here’s what it looks like with the two DIs:
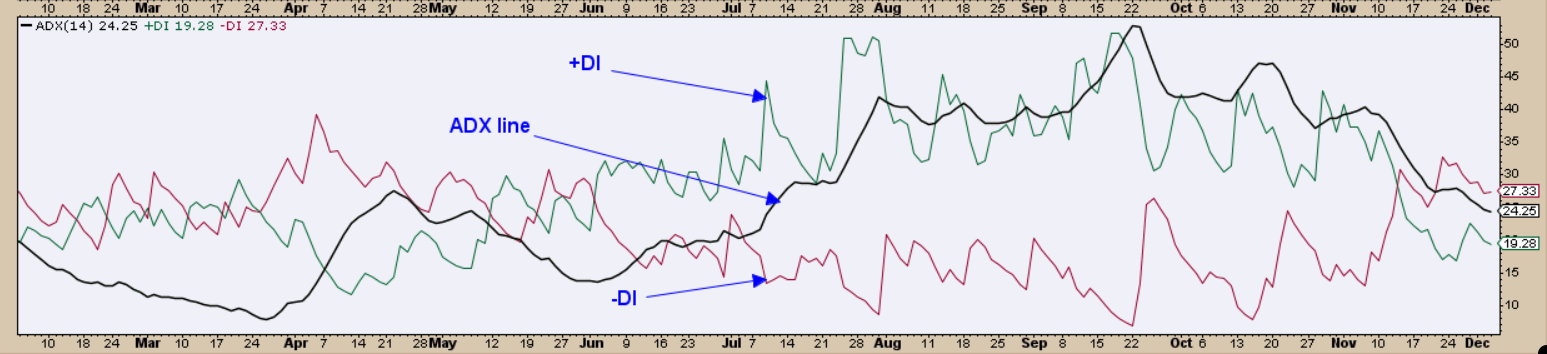
FIGURE 1. ADX WITH +DI AND -DI. The DIs tell you whether the bulls or bears are in control while the ADX line tells you whether the trend is strengthening or weakening.
Now here’s the ADX line with the DIs.
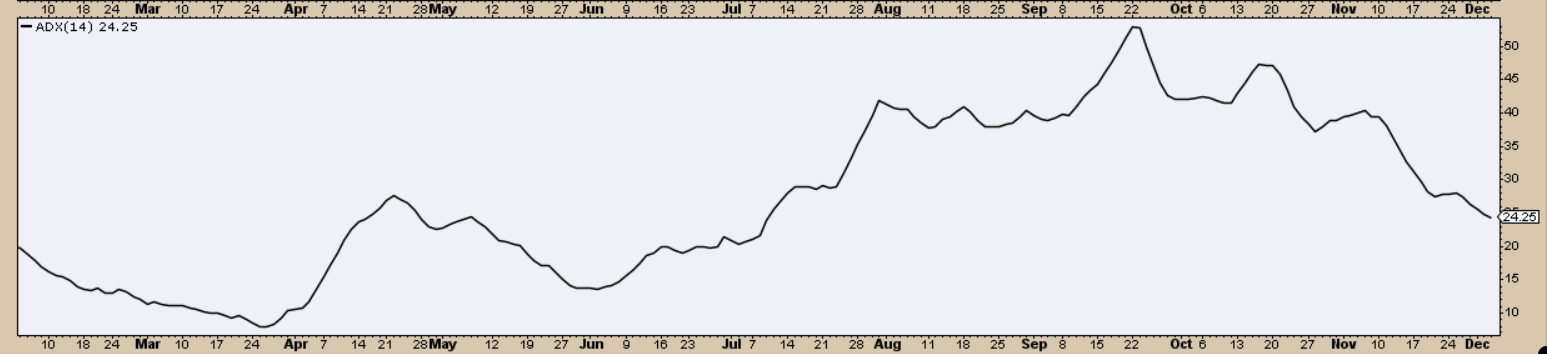
FIGURE 2. ADX LINE MINUS THE +DI AND -DI. This is what we’ll be focusing on.
Because StockCharts offers an ADX-only indicator (in addition to the traditional ADX), we’ll focus squarely on the ADX line itself.
In other words, you don’t need the DI lines to apply the core lesson of this law. But first, let’s backtrack for some context.
How Many Other Traders Use the ADX
Welles Wilder offered a simple rule of thumb: above 25 = trending, below 20 = not trending.
And yes, a lot of traders still use it that way. If you look at the chart below, you can see why. It does catch the big trend.
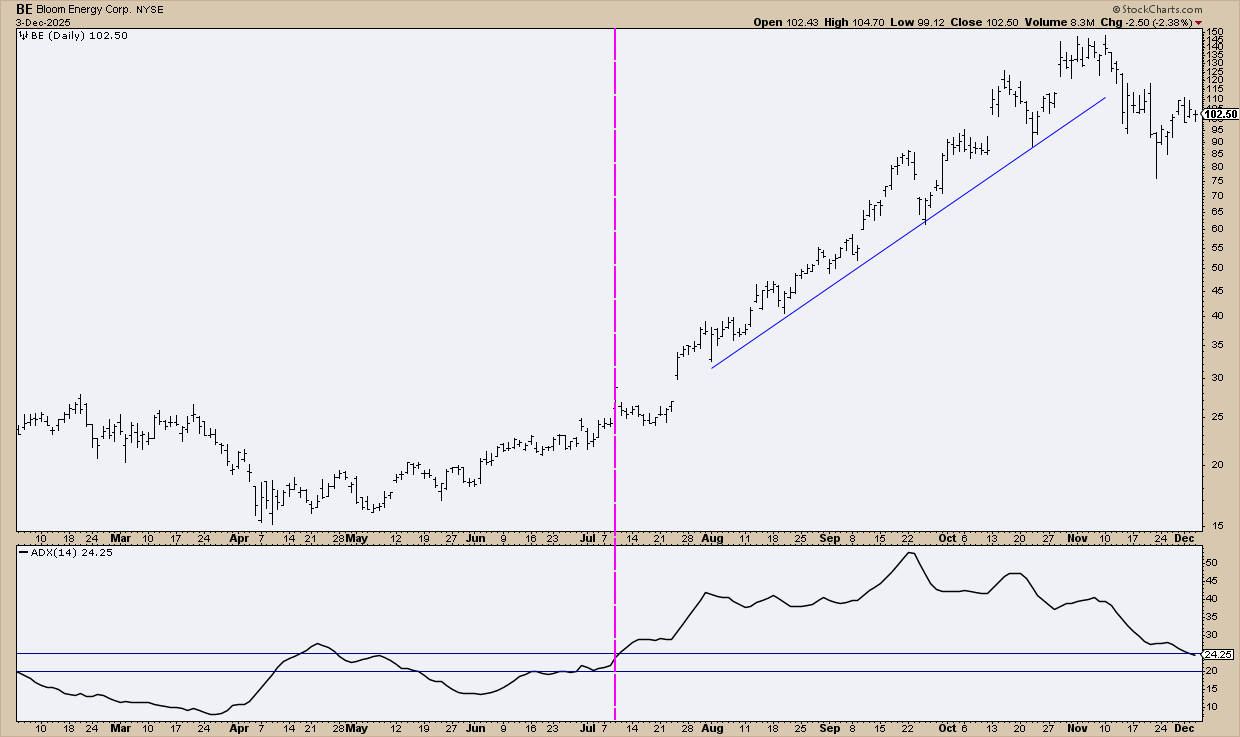
FIGURE 3. DAILY CHART OF BLOOM ENERGY CORP (BE). The 20 - 25 approach does catch a meaningful trend. But it also misses smaller trends and an earlier start.
Using the 20–25 zone does a solid job of identifying the major trend. The vertical magenta line marks the shift from “non-trending” to “trending.”
So to be clear: this is a valid way to use ADX. And another important thing to note is that, depending on the asset’s volatility, some traders simplify this by just using the 20-line (instead of 20 and 25).
But Murphy takes a slightly different, and more dynamic, approach. Instead of focusing on where ADX sits, he focuses on what it’s doing. Let’s take a look.
How Murphy Wants You to Read the ADX Line
Let’s forget thresholds for a moment. Murphy’s original guidance is about movement, not levels:
- Rising ADX = trend strength is increasing
- Falling ADX = trend strength is fading
- Flat ADX = no meaningful trend
Here’s the same chart as above, but using Murphy’s rules.
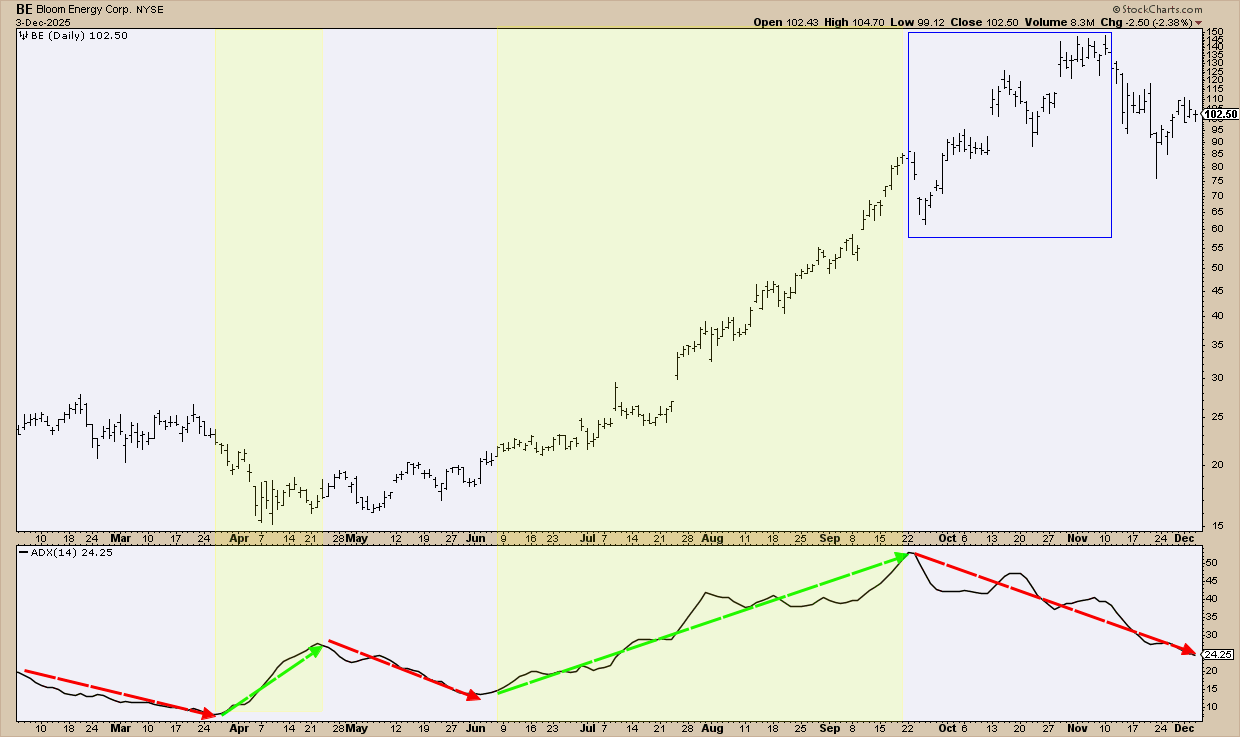
FIGURE 4. DAILY CHART OF BLOOM ENERGY CORP (BE). It catches the small and large trends, but you have to use nuanced judgment.
The yellow shading highlights periods when the ADX is rising. Take a quick look and you’ll notice it does a solid job of catching both small and large trends.
That said, this is where judgment comes in. To stay with the uptrend, you had to remain flexible even as ADX eventually began to roll over. No indicator is perfect. Neither ADX approach will catch every move.
So, what does that mean? It means that your edge comes from developing your own feel for how it behaves, and fine-tuning your interpretation over time.
Now It’s Your Turn
Here’s a chart of Caterpillar Inc (CAT). It’s not the easiest ADX read, but most of your charts are probably going to have similar challenges. Take a look at it first and afterwards, I have a few challenges below.
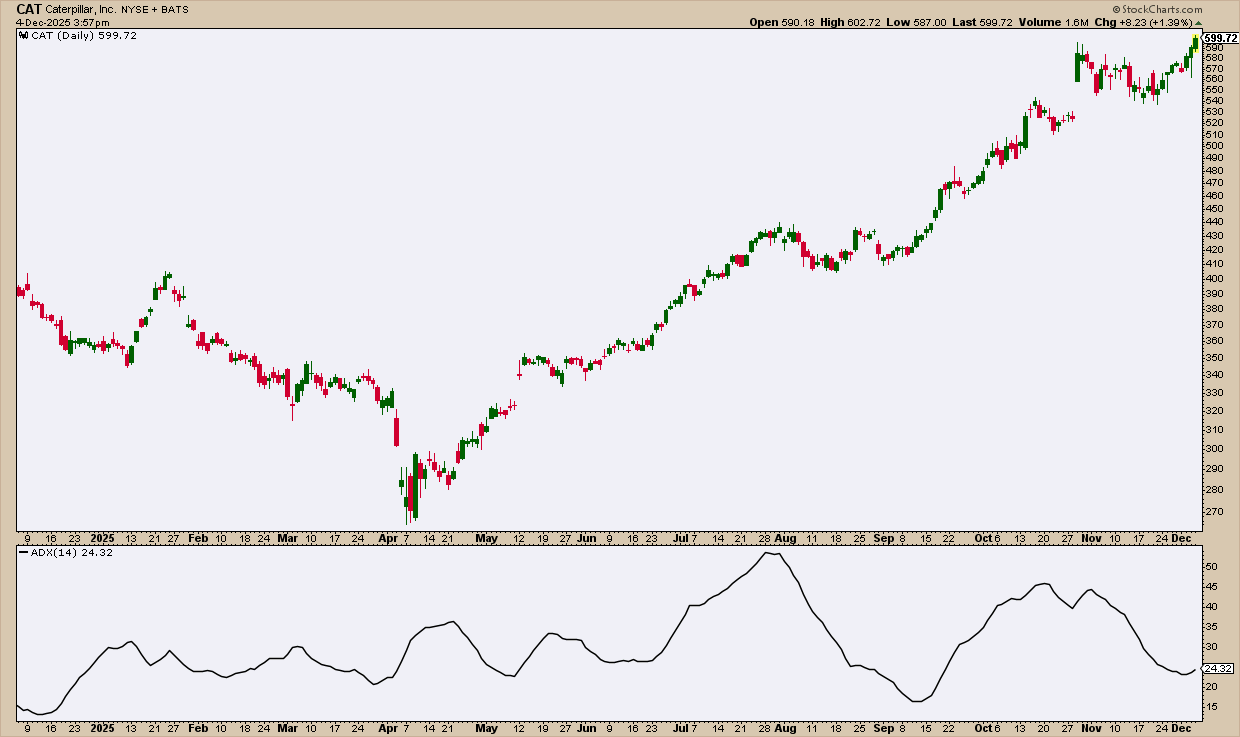
FIGURE 5. DAILY CHART OF CAT. How would you approach this ADX reading?
There’s more than one “right” way to read this setup. You could follow Murphy’s approach by watching the direction of ADX. You could use Welles Wilder’s original method with the 20 and 25 levels. Or you might prefer the simplified 20-line filter.
But here’s the real question: why did you choose that method over the others? What are you actually trying to solve with ADX in this moment—trend strength, trade timing, or market regime?
If you want to see my solution, click here. It’s not the only valid answer, but it’s how I personally process this chart. Here’s what I was thinking:
- Market structure is king: swing highs and lows, and breakouts are the most important thing for me.
- I used both Murphy’s and the simplified 20-line approach (the chart annotates why).
- Declining ADX during a strong trend can signal a weakening; but this weakening can be no more than a pullback leading to a breakout.
Insider Tip: Don’t Expect the ADX to Turn Quickly
ADX is heavily smoothed and lags on purpose. But that’s exactly why it’s dependable for defining your trading environment.
Murphy’s intent is clear: Use ADX to choose your strategy, not to fine-tune entries and exits.
And That’s a Wrap
John Murphy’s Law #9 is your market environment filter. Rising ADX? Price may be trending. Lean on tools and strategies that cater to trends, breakouts, and momentum. Falling ADX? You’re in range territory. You might shift to oscillators, watch support/resistance, and possibly mean-reversion plays. It’s about asking “what kind of market am I in right now?” And knowing the difference can help keep you on the right side of the market.


