StockCharts Insider: The Hack to Hunting Early Leaders with New-Highs Scans
Before We Dive In…
Ever watch a stock take off and think, “I wish I had gotten in earlier”? You probably could have. It’s just that early leaders rarely look like leaders at first. The good news is that there are ways to spot and measure emerging strength before everyone else does. That’s what we’re diving into in today’s Insider article.
Spotting Strength Before the Crowd
When you scan for market leaders, it’s easy to end up chasing stocks that have been running for some time. The real opportunity lies in spotting those names before they become obvious to everyone else. New highs can be early clues to emerging leadership.
The problem? Not every new high signals resilience. The trick is telling the difference between strong and weak advances. In this article, I’ll show you how to make that distinction so you don’t end up jumping onto a limp rally.
Why New Highs Matter
Go to your Sample Scan Library and scroll down to Technical Indicators. Does this look familiar?
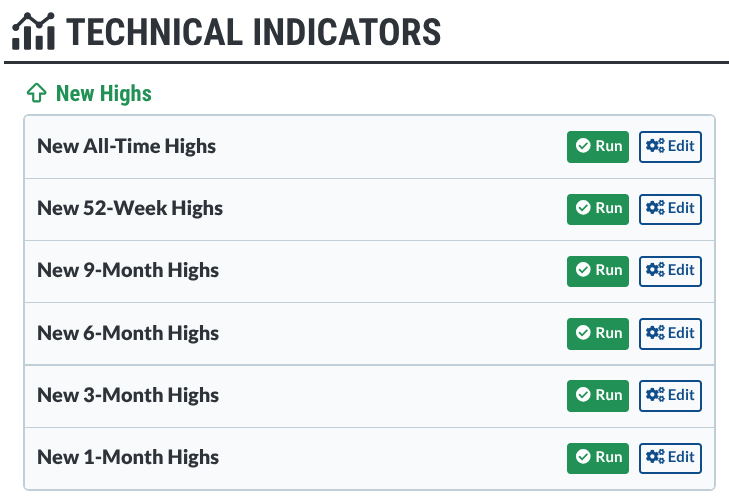
Here’s what I’m thinking: New 9-month, 52-week, and All-Time highs spell out leadership. While stocks in these categories are worth looking into, wouldn’t it have been nice to find these names earlier, as they were developing into top performers?
So let’s focus on the first three—1-Month, 3-Month, and 6-Month highs—for context. Here’s how I interpret them:
- 1-month high: The stock is perking up right now. Traders are paying attention.
- 3-month high: It’s working its way either out of last quarter’s chop or above last quarter’s rallies.
- 6-month high and greater: This indicates serious leadership potential. The big funds are starting to care, and the majority of the retail crowd is likely to follow (unless it’s a popular or meme stock that has retail jumping in first).
What you want to know: “Who punched through a ceiling, and how important is that ceiling?”
Your goal: Jump in early, anticipating a future outperformer.
How to Scan for Early-Stage Leaders
If you’re trying to spot future leaders before they’re everyone’s favorite stock, you’re limiting yourself if you just scan for the top gainers (like New 52-week highs), hoping for a dip to jump in.
Here’s one of my methods. Copy it exactly, or tweak it for your style. Either way, the playbook goes like this.
Step 1 - Start with a New 1-Month High scan
Run a New 1-Month High scan. If the market’s green, you’ll probably get a giant list of tickers. Now what?
- Sort by Volume if you want liquid, recognizable names.
- Sort by SCTR if you want technical strength. I like stocks with SCTRs in the high 60s to 70s; not quite weak, not overheated, but starting to flex strength.
Step 2 - Pull up a chart
The next logical step is to begin charting stocks that catch your eye. But here’s where an Insider tip can help.
Insider Tip: Add two Price Channels: 20-day (to see the 1-month high/low) and 126-day (to see the 6-month high/low).
Here’s how to read it:
Price breaks above both the 20-day high and the 126-day high: That’s potential leadership. Money is rotating into it, and more is likely to boost it.
Price above the 1-month high but still below the 6-month high: That’s early momentum trying to advance. The 6-month high is the next critical decision point, and there are two common plays here:
- If you’re already long, you can take profit as price heads into that 6-month resistance in case it rejects it.
- If you’re not yet in, you simply wait. If price smashes through the 6-month high on volume, that’s your breakout entry.
The lower 20-day band: This can be your trailing stop for short-term trades, or your buy-the-bounce level if you’re looking to buy the dip.
The lower 126-day band: If it’s not “miles” away, longer-term traders can use it as a wider trailing stop or a spot to scale in on a bigger pullback.
The point is simple: with just those two channels, you can tell if you’re looking at a real emerging leader, a short-term pop that still has overhead resistance, or something you shouldn’t chase at all.
Insider Tip: Plot the Chaikin Money Flow (CMF) below the chart and an SCTR Line indicator above it.
Why these two?
- CMF: If volume precedes price movements, which is often the case, the CMF measures the amount of money flowing into (or out of) the security you’re looking at. It graphically shows you the amount of buying pressure or selling pressure driving price.
- SCTR Line: SCTR Lines are important for measuring the technical strength of a stock or ETF. Is a price advance coinciding with a strengthening line? Is that line entering a bullish range (76+ is my criteria for bullish)? Or has it been exceedingly bullish (like, well above 90) for some time?
Interpreting CMF and SCTR against price is where your judgment comes in. It’s not “textbook.” This is the part that’s more art than science.
Take a look at this example.
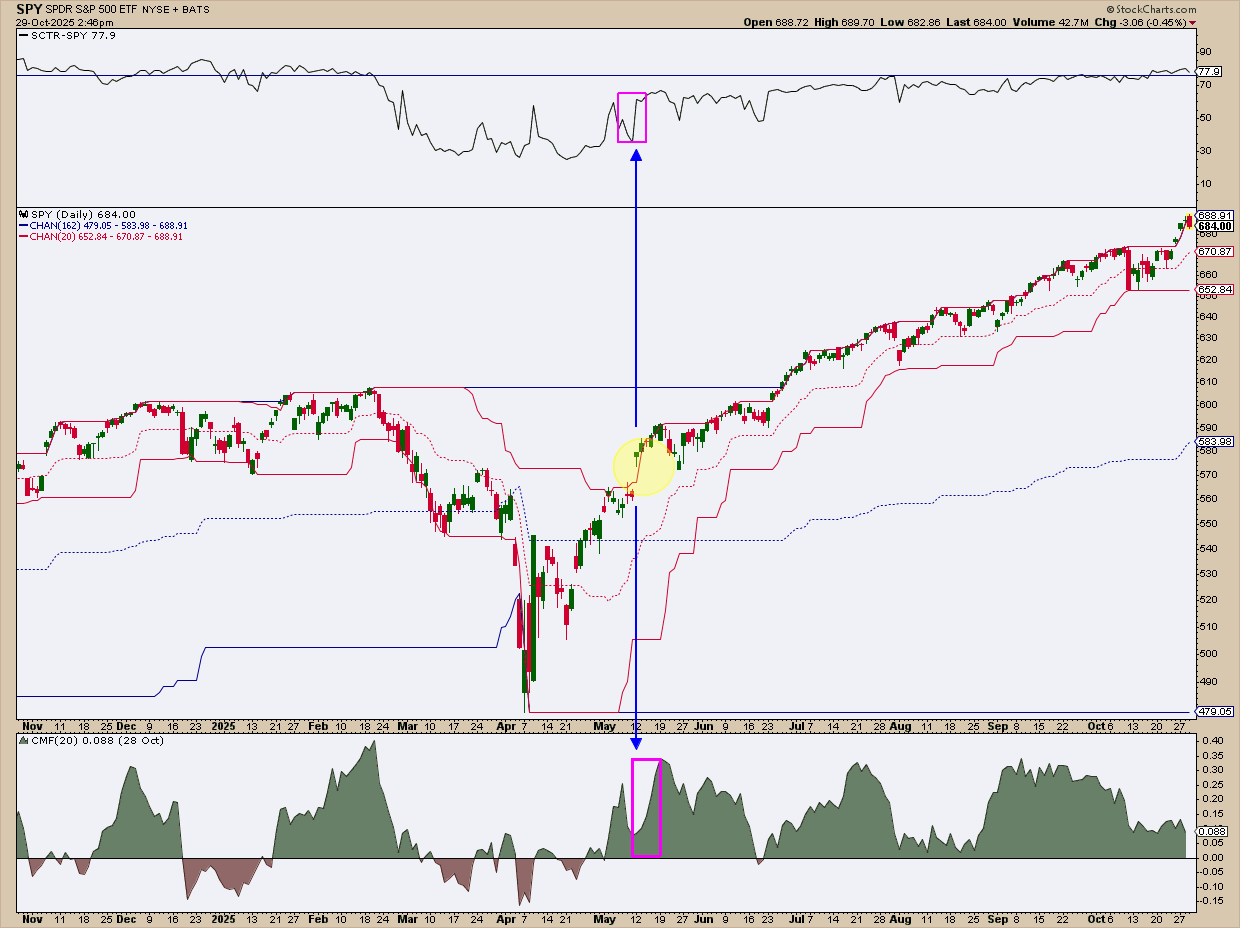
Look at the yellow-shaded circle. That’s where the SPDR S&P 500 ETF (SPY) made a new one-month high via runaway gap. Early signs of a recovery?
At the time, it was a mere possibility, but a few clues might have stacked the odds in favor of the upside. The CMF showed that buying pressure, which was above the zero line, was surging. The SCTR, indicating technical strength, also began rising.
As SPY rose to challenge its 6-month high, you could have kept a trailing stop slightly below the 20-day channel’s low and, if you did, you’d still be in the trade.
Now It’s Your Turn
Take a look at the Western Digital Corp. (WDC) chart below.
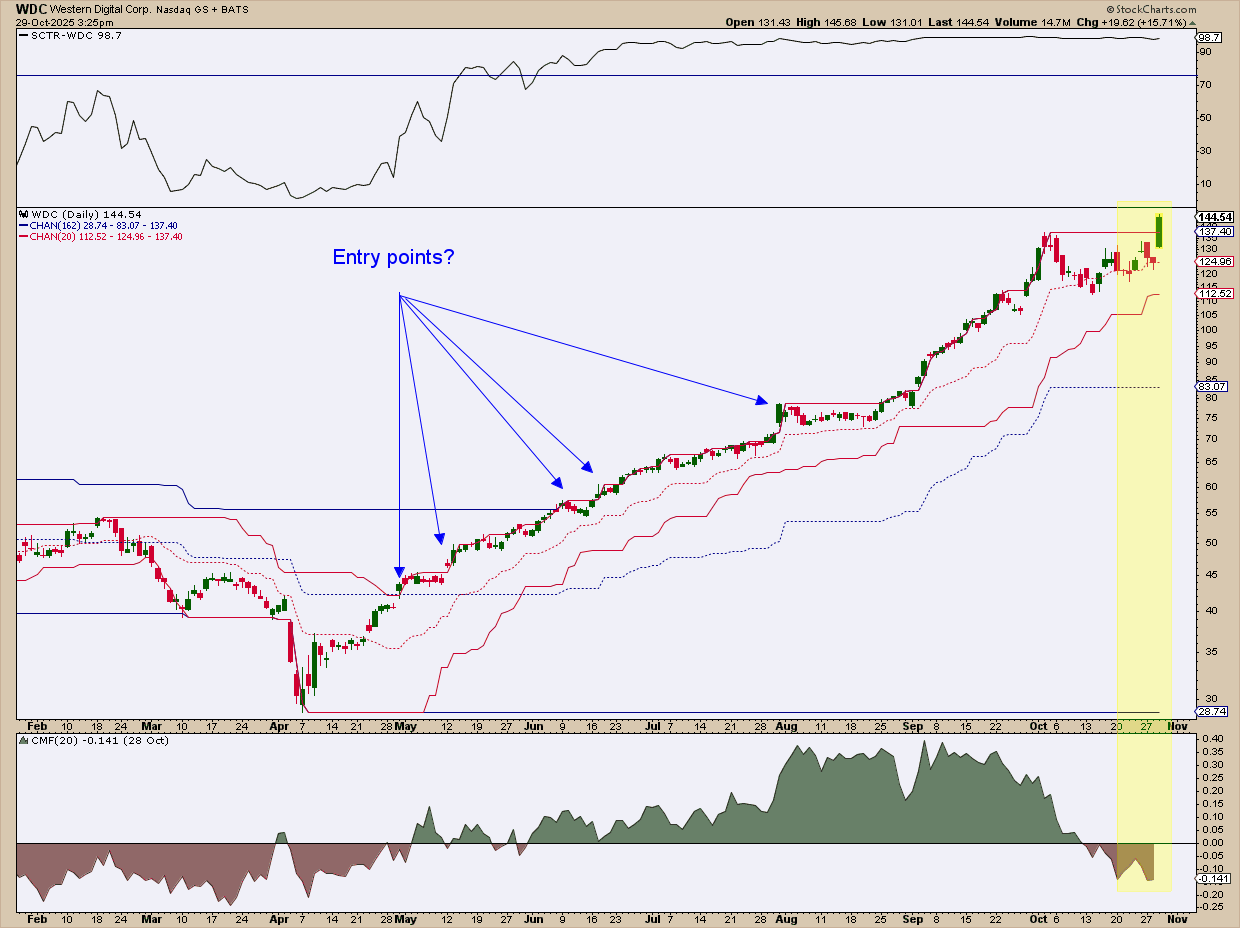
Now, walk through it like you actually had real money on the line:
- Which breakout would you have bought? The first two 1-month breakouts; the later breakouts? Why that one, specifically?
- If you took the May breakouts, where does your stop go? Just below obvious price support, or under the lower band of the 20-day channel?
- Look at the far right of the chart. Price made another new high, but CMF is rolling over, showing sell pressure coming in. Do you still take that long, or do you pass?
There’s no single “correct” answer. What is correct is having both a reason for the entry and a defined exit for if you’re wrong. Did you have both for every trade you just mentally took?
Personally, I would have taken the second trade, placing a stop under the congestion level. I would have added to the position once it made a new 6-month high, trailing a stop under the lower band of the 20-day channel. That’s my take. What’s yours?
And That’s a Wrap
The goal here is to detect early leadership; to recognize potential leaders before the crowd catches on. Combine your new-high scans with SCTR, CMF, and Price Channels, then layer in some nuanced judgment. If you do it right, you’ll quickly see who’s turning into a leader, and who’s setting up a fakeout.


