StockCharts Insider: The Missing Step in Ichimoku Cloud Breakout Strategies
Before We Dive In…
Ichimoku Cloud breakouts can be an incredibly effective way to jump into a trend but only if you follow the right steps when pulling the trigger. You can easily find these breakouts while fine-tuning your criteria using StockCharts’ Updated Scan Filters. However, if you simply focus on the breakout, your edge becomes inconsistent if not shaky. You need to filter out potentially bad trades. And this is something rarely talked about. That missing filter is the focus here.
The Problem Isn’t Ichimoku—It’s the Way the Strategy is Commonly Taught
Go online, and lots of sites teaching Ichimoku strategies will say that when price is above the cloud (aka, the kumo), it’s a bullish sign. Well, yes, but not quite yet.
The cloud represents future support and resistance. It’s an area of projected market balance. If price breaks above it, then resistance has been exceeded. But one critical question remains unanswered: Will the market accept and maintain the higher price? A breakout alone won’t tell you that, as it leaves open important possibilities:
- What if it’s short covering?
- What if a news report causes a one-day spike?
- What if thinner liquidity exaggerated a bullish move?
- What if it’s late buyers chasing strength?
With all this in mind, that bullish move over the cloud doesn’t seem so certain, does it?
Experienced Ichimoku traders wait for something far more important: re-acceptance above the Kijun-sen. And that’s the missing step not often taught when describing this strategy.
The Role of the Kijun-sen
Kijun-sen represents the market’s medium-term equilibrium. It shows the midpoint over the last 26 periods (roughly one trading month). More importantly, it suggests a dynamic area of equilibrium; that is, where market participants “agree” value currently exists.
When price is above the Kijun, the market is structurally bullish. If price can’t hold above it, the breakout is likely fragile. This is why it's important to wait for Kijun-sen re-acceptance following a cloud breakout. And that can’t happen without a pullback.
The Strategy: Kumo Breakout + Kijun Re-Acceptance
Here is the full setup:
1 - Price breaks above the cloud
2 - Price pulls back toward the Kijun-sen
3 - The Kijun holds as support (a bullish rejection)
4 - Price resumes higher
Only after Step 3 should you consider the breakout to be valid. In short, the Kijun retest and bounce confirms the trend.
What Kijun-sen Re-Acceptance Looks Like
Take a look at this chart of iShares Russell 2000 ETF (IWM).
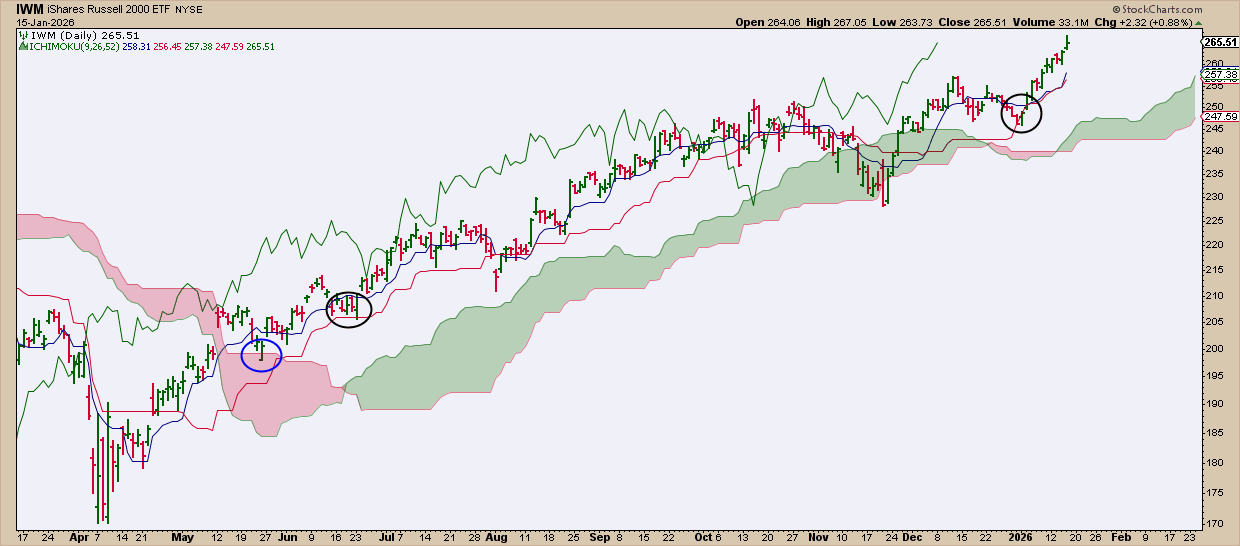
In May, price breaks above a thick bearish cloud (blue circle). That’s your first alert, but it’s not a signal for entry. The strategy calls for a re-acceptance into the Kijun-sen. Initially, price stalls at the cloud, which also acts as support. Some traders might have treated this as an entry signal because it, too, is a legitimate bounce. A few sessions later, however, we see price bouncing off the Kijun-sen (black circle) and holding above it. That’s the re-acceptance we were looking for, and a signal that the breakout is likely to hold.
You see the same pattern again in January 2026. Price breaks out, drifts back to the Kijun-sen, tags it, and then bounces (black circle). Same play, same message: the Kijun-sen flips from resistance to support, and the trend gets a green light.
What this Filter Does
So, what happens when you add the Kijun-sen as a filter? Generally, it aims to do three things:
1 - Help eliminate weak breakouts: Nobody wants to get snared in a bull trap.
2 - Improve reward-to-risk: The Kijun (or cloud) gives you a close support level for entry (and exit should the trade fail).
3 - Align with Ichimoku’s original design: Ichimoku was built to graphically show trend and equilibrium in addition to breakouts; it’s all about context.
Now, you give it a try. Here’s an easy one; take a look at this Apple, Inc. (AAPL) chart.
Spotting Kijun-sen Re-Acceptance and Support

You can spot a Kijun-sen + cloud retest, plus several opportunities where the Tenkan-sen offered entry signals and the Kijun-sen worked as a trailing stop. Can you find them?
Here’s what I see.
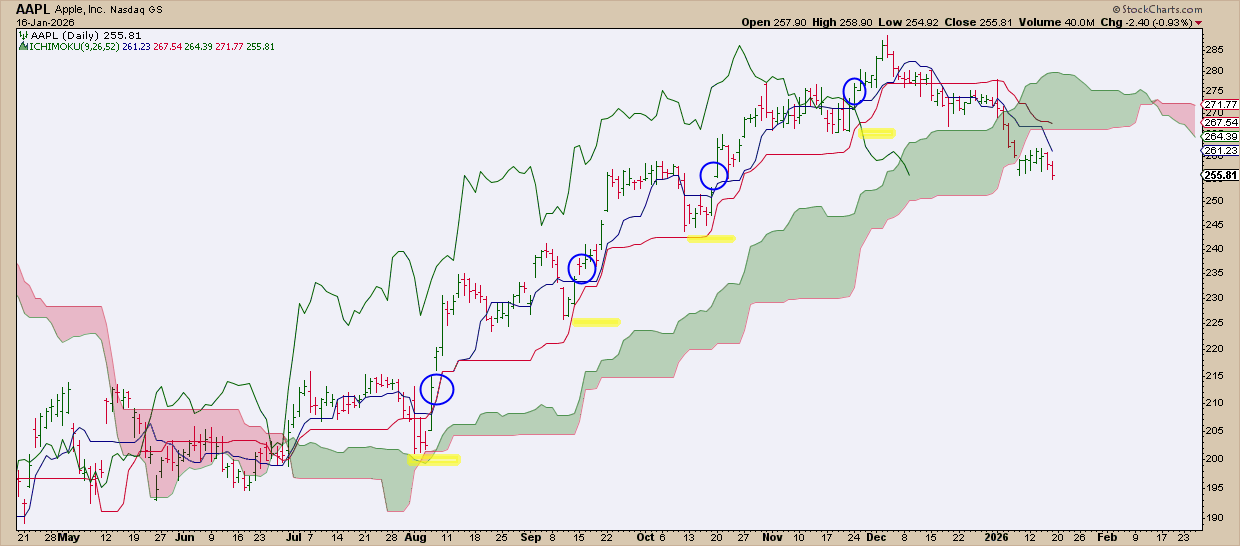
Now, these are my personal approximations for entry points and stop losses. Yours may differ. But I think this gets the point across.
Insider Checklist: How to Spot a Valid Kijun Re-Acceptance Setup
If you want to use this strategy, here’s a five-step checklist to follow:
- Price breaks above the cloud
- Kijun-sen sits below price
- A pullback toward the Kijun-sen
- Small candles or hesitation at the Kijun
- A clear expansion higher
If one of these is missing, the strategy is not compatible with the price action.
And That’s a Wrap
I hope you found this to be pretty simple, because it is. But more importantly, it’s clear and easy to follow. Like any strategy, it won’t work every time. But waiting for Kijun-sen re-acceptance can help you avoid weak breakouts and focus on the ones likely to have real follow-through. The main point: don’t just trade the breakout; use the Kijun-sen for confirmation.