StockCharts Insider: The Participation Signal Many Traders Miss - Percent Above Moving Average
Before We Dive In…
In our last breadth article, we explored how Point & Figure buy signals give a unique angle on index strength or weakness. Today, we’re going to widen our breadth lens across four time horizons, which will give us clues on strength from periods of short-term volatility to longer-term structure. Let's talk about Percent Above Moving Average.
One Indicator, Four Time Horizons
The Percent Above Moving Average shows you how many stocks in a given index are trading above a chosen moving average. The calculations are pretty simple: taking the S&P 500, if 350 stocks are above a certain moving average, that participation is around 70%.
Why’s this important? The S&P 500 is weighted toward bigger names; mega-caps that can drag the index price higher even though most stocks aren’t participating. This can also be deceptive. Healthy rallies need broad participation, so if only a handful of stocks are doing the lifting, the advance can be fragile. And you’ll want to spot this early.
Looking at various moving averages can help you understand different levels of participation. Here are a few suggested ways to think about it:
- 20-day MA -> Short-term momentum
- 50-day MA -> Swing-trend participation
- 100-day MA -> Intermediate trend participation
- 200-day MA -> Long-term market health
Each timeframe serves a different purpose and answers a slightly different question. Together, however, they form a participation dashboard.
How to Read Participation Across Timeframes
When participation drops, it rarely drops all at once. It goes in stages, and MAs are great for observing those stages.
For example, a strong market typically looks like this:
- Most stocks above the 200-day MA.
- A large percentage above the 100-day MA.
- A good chunk of participation above the 50-day MA.
- Short-term participation holding up above the 20-day MA, though this fluctuates frequently due to short-term volatility.
Now, when markets weaken, deterioration often begins short-term:
- Stocks begin falling below the 20-day MA.
- Participation weakens above the 50-day.
- Later, the 100-day participation rolls over.
- Finally, the 200-day breadth breaks.
Often, participation weakens before price trends change.
Conversely, after market bottoms, short-term participation improves first, followed by intermediate- and then long-term participation.
Why is this important? It helps you distinguish healthy pullbacks from more concerning corrections. On the bullish side, it helps you see the recovery process, giving you better context for when to re-enter the market.
Let’s see how this plays out on an actual chart.
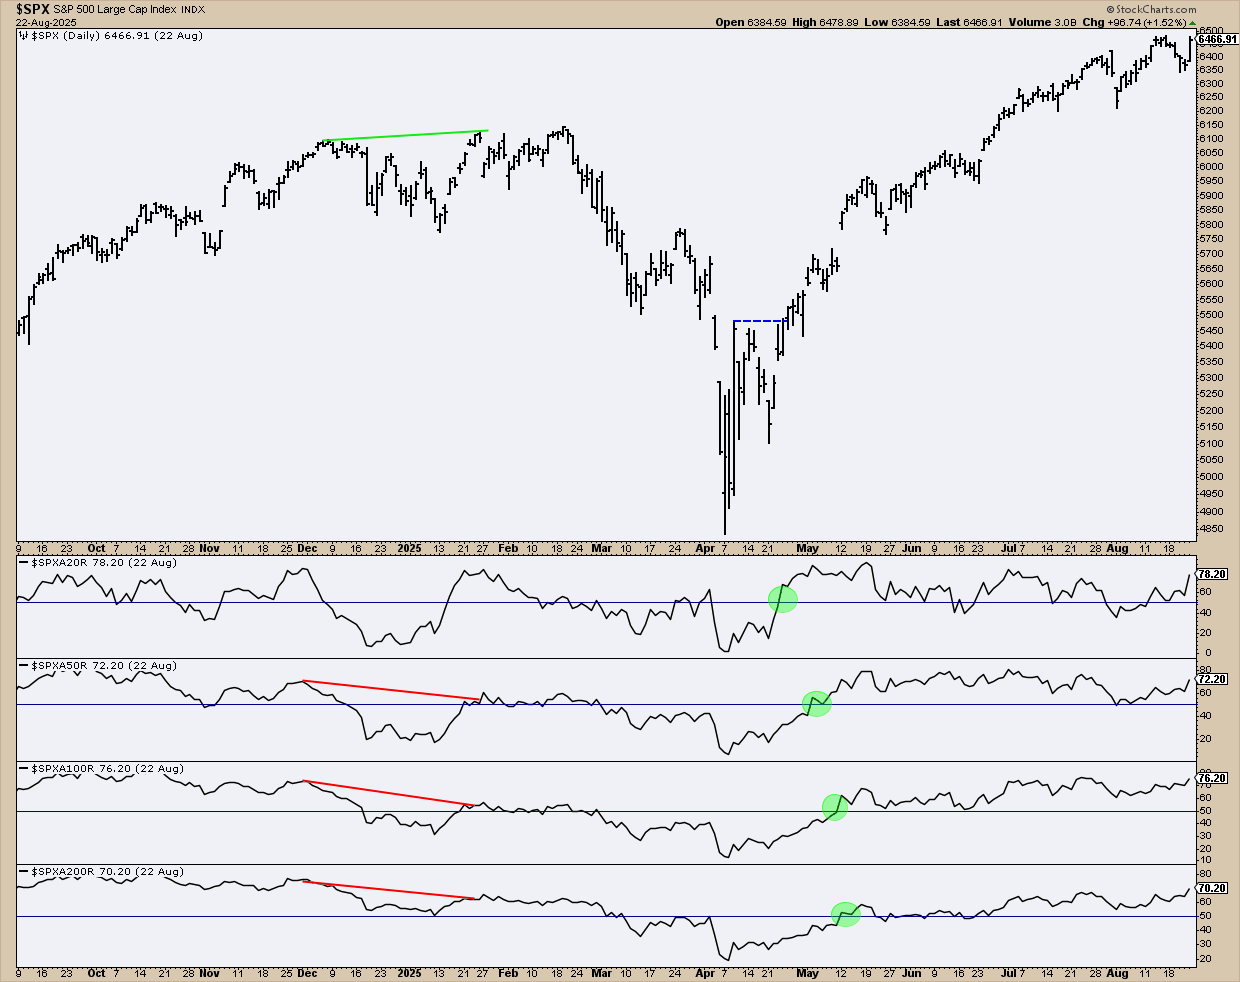
Watch how the S&P 500 squeezed out slightly higher highs through December, January, and February. The green line marks where the climb begins. Yet, underneath, the Percent Above Moving Average readings (50-, 100-, and 200-day) told a different story, with participation starting to slip even as prices rose. Once fewer than half the stocks remained above their moving averages, the rally lost internal support, and the index took a sharp tumble.
Did the Percent Above Moving Average indicators predict the drop? Not exactly. But it flashed warning signs that the majority of the players in the index were slowly bowing out of the rally.
Now jump to the April bottom. When price breaks above resistance (blue dotted line), participation returns. You saw it first in the fast 20-day, then spreading to the 50-, 100-, and finally the 200-day readings. Breadth rebuilding across timeframes suggested pullbacks weren’t breakdowns. They were buying opportunities within a strengthening recovery.
A Few Insider Tips
Insider Tip #1: Leadership often emerges before it makes headlines. Participation often improves weeks before sentiment and news turns bullish. This allows you to get in on a trend early. As a note, you can find the major indices and more by searching the updated symbols list for this tool.
Insider Tip #2: Pullbacks usually reset short-term participation. During strong uptrends, participation dips in the 20- and 50-day can signal buying opportunities if participation in the 100- and 200-day are intact. Check market structure and other indicators for confirmation that this is the case.
Insider Tip #3: Long-term breadth matters most. When a majority of stocks fall below their 200-day moving averages, market risk typically increases significantly.
And That’s a Wrap
Percent Above Moving Average shows how many stocks are actually pushing the market higher. When participation shrinks, rallies can wobble. When more stocks climb back above their key moving averages, strength spreads. Use it on your index charts to see if a move has real support or is starting to sputter.