Stocks Are Climbing Again, But Are We in the Clear?

Key Takeaways
- Stocks are showing renewed strength with major indexes moving above key moving averages.
- Stock market volatility has eased, but some risks are lurking.
- Upcoming inflation data could shape interest rate expectations, which may impact bond, gold, and stock prices.
What a difference one news headline can make!
With the U.S. and Iran agreeing to a two-week ceasefire and talks reportedly underway between Israel and Lebanon, investor attention has shifted back to stocks. Now, the S&P 500 ($SPX), Nasdaq Composite ($COMPQ), and Dow Jones Industrial Average ($INDU) are all trading above their 200-day simple moving averages (SMAs).
You can see this shift in investor sentiment across the board. On the Market Summary page, for example, if you sort the US Indexes in the Equities panel by +/- SMA(200) column, you’ll see that all major indexes are trading above their 200- and 50-day SMAs, as well as their 20-day exponential moving averages (EMAs).
Switch to the Global Snapshot tab and you’ll notice a similar picture when you sort by the +/-SMA(200) column. In the Country Funds column, the iShares MSCI South Korea Capped ETF (EWY) currently stands out as the strongest performer.
Volatility Pulls Back
Volatility is starting to cool off. The Cboe Volatility Index ($VIX) continued heading lower after its +18% drop on Wednesday. It closed at 19.49 on Thursday, which is the first time the VIX has fallen below 20 since February 28.
The easing can be seen in oil price volatility. The Cboe Crude Oil Volatility Index ($OVX) has pulled back as well, although it remains elevated.
An interesting observation in this chart is that OVX began moving higher in January 2026, pulled back in early February, and then pushed higher in mid-February, well before February 28. It almost reached 126 on March 12 before pulling back.
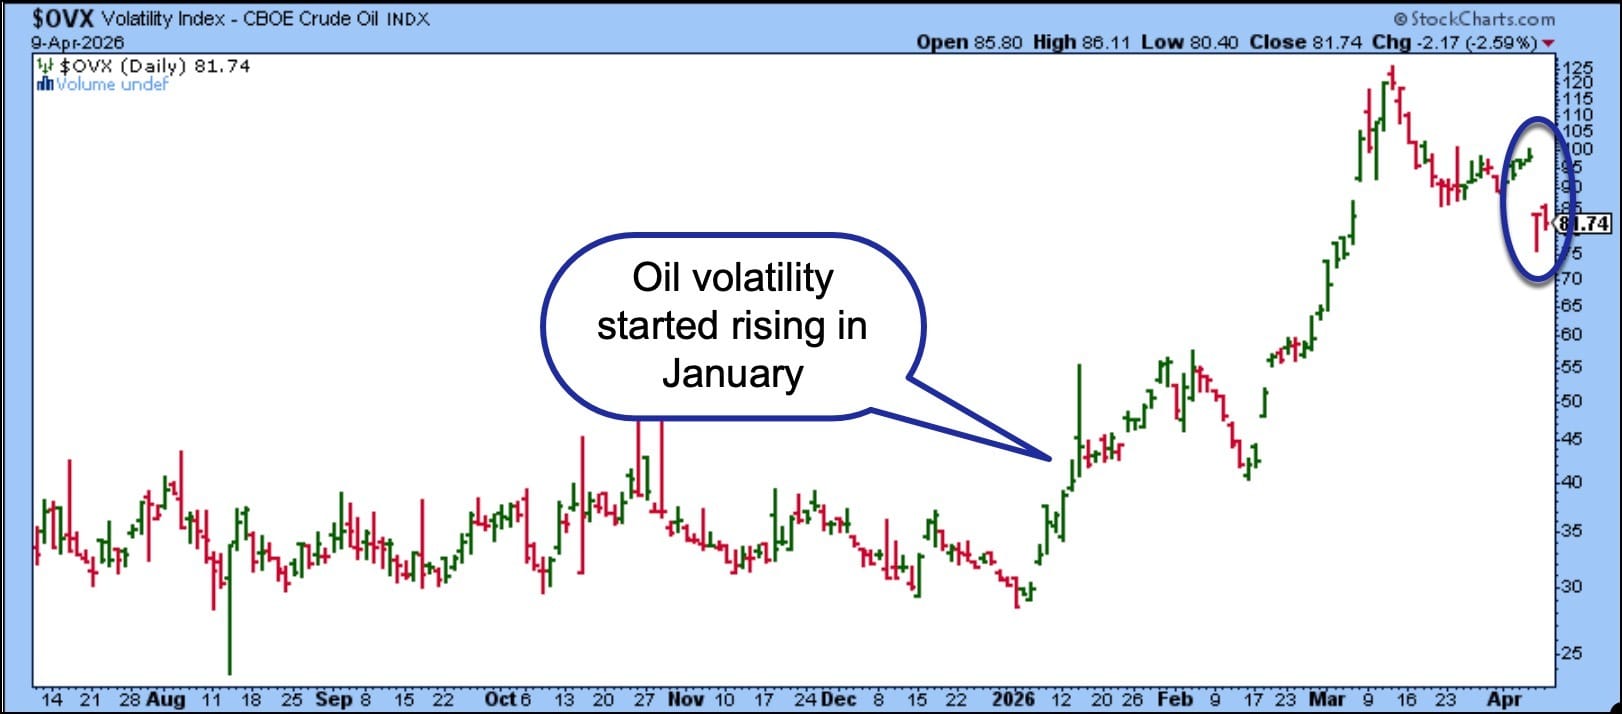
On Wednesday, OVX gapped lower but closed in the upper end of the day’s range, which suggested that oil volatility could move higher the next day. It did move higher early Thursday but, after reports that Israel would negotiate with Lebanon, OVX retreated and closed at 81.74. It’s still high, but at least it’s well off its March 12 peak.
Crude oil prices have also pulled back from their highs, with light crude ($WTIC) trading at $98.72 per barrel. It’s still high and will likely remain that way until we start seeing ships moving through the Strait of Hormuz. If traffic starts to return to normal, oil prices could fall further, which could help support bond prices. Inflation is another factor; more on that below.
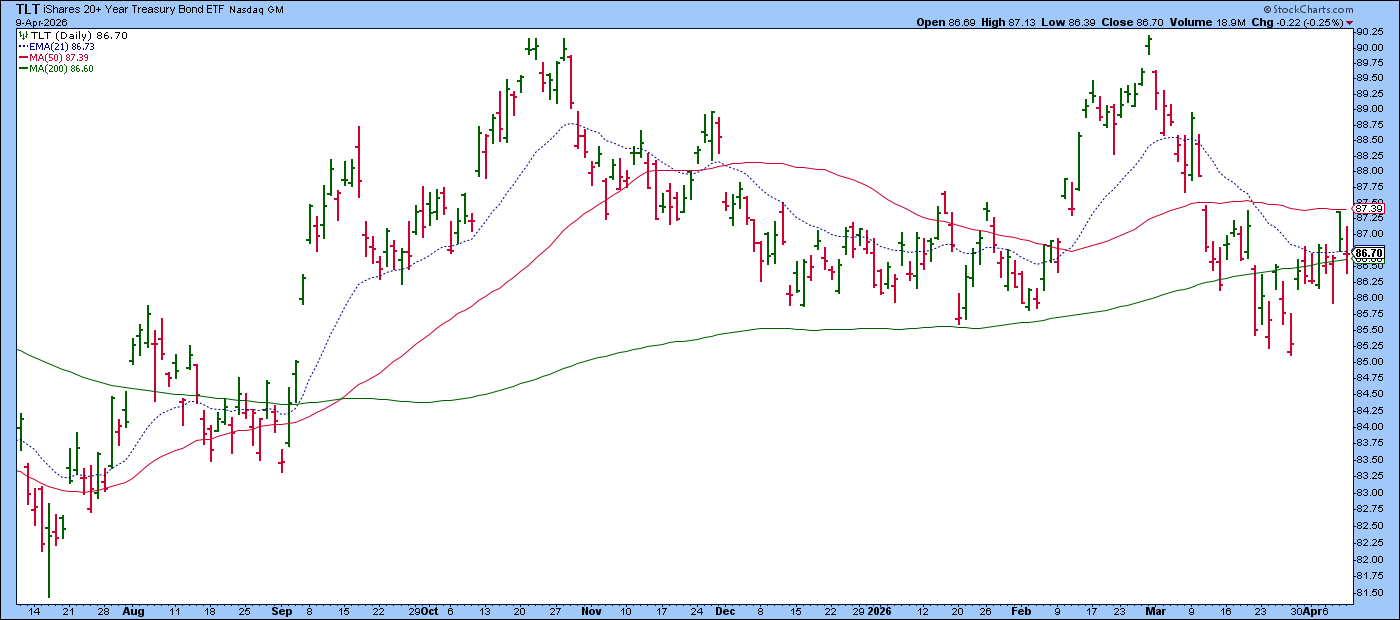
In the daily chart of the iShares 20+ Year Treasury Bond ETF (TLT), you can see that on Wednesday, when equities popped higher, TLT faced resistance at its 50-day SMA (red line) while support held at the 21-day EMA (dashed blue line). On Thursday, TLT closed slightly below its 21-day EMA.
Inflation Still Front and Center
Higher oil prices have raised concerns that inflation could remain sticky. This has lowered expectations of interest rate cuts in 2026. Thursday’s PCE report came in line with estimates, but core and headline PCE, which are at 3% and 2.8% respectively, are still higher than the Fed’s 2% target.
Let’s see if Friday’s CPI for February also comes in line with estimates. If it does, we’ll probably see bond prices remain stuck within their current range. If inflation runs hotter than expected, the stock market could react quickly. Rate-cut hopes may fade, bond prices could come under pressure, and stocks may lose some of their recent enthusiasm.
As of this writing, the CME FedWatch Tool shows a 31% probability of a rate cut at the December 2026 FOMC meeting. Until then, the odds lean toward keeping rates on hold.
The Ripple Effect
The low probability of rate cuts in 2026 could be holding back gold prices. In the five-year weekly chart of spot gold, the blue horizontal lines mark Fibonacci retracement levels from the October 2022 low to the February 2026 high.
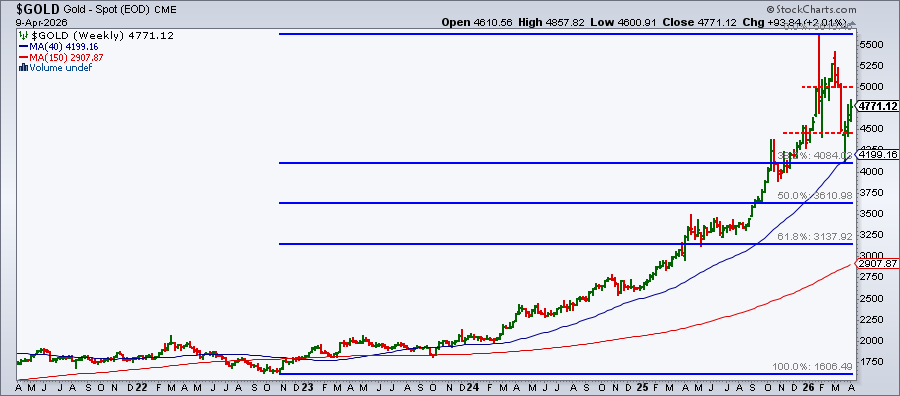
Note that the price of gold pulled back to the 38.2% level, which also lined up with the 40-week SMA, and then bounced off it. If gold continues to move higher, the next likely resistance level would be around 5,000. If it breaks above that level, we could see a retest of the highs. On the other hand, if gold moves lower and breaks below 4,550, it could head back down toward the 38.2% Fib level.
Closing Position
As we head into the end of the trading week, there are two key factors investors should keep on their radar: inflation data and oil prices. Both could impact bond, gold, and equity prices. While the broader equity indexes may have recovered their March losses, the muted response in gold prices and hesitation in bond prices suggest this market may still be unstable. Keep an eye on the charts and monitor the key levels.
Disclaimer: This blog is for educational purposes only and should not be construed as financial advice. The ideas and strategies should never be used without first assessing your own personal and financial situation, or without consulting a financial professional.