Stocks Bounce Back: Is This the Start of Something Bigger?
Key Takeaways
- Market breadth is improving with more stocks trading above key moving averages
- Sentiment remains cautious as put/call ratios and the McClellan Summation Index suggest traders aren't fully convinced of a sustained move higher
- The risk-on mindset is back as the odds of a Fed rate cut have increased significantly from last week
Thanksgiving might be ahead, but the market’s not taking the week off. After last Thursday’s selloff, stocks seem to be catching their breath, as buyers stepped back in and all the major indexes finished higher on Tuesday.
The big question is: Are we gearing up for another leg higher, or is this just a little pre-holiday profit-taking? Let’s dive in and find out.
Starting with the daily chart of the S&P 500 ($SPX) a few things jump out.
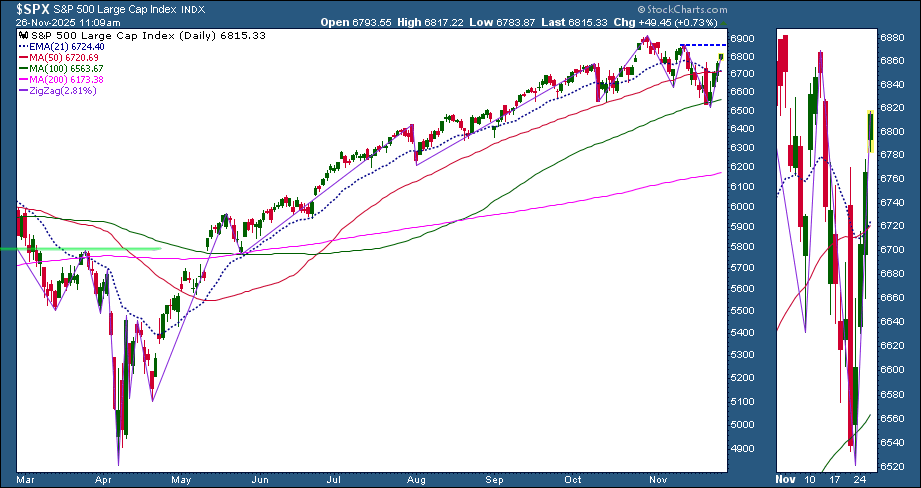
- Tuesday’s close pushed above the 21-day Exponential Moving Average (EMA) and 50-day Simple Moving Average (SMA). That’s generally a bullish sign.
- The 21-day EMA is still sloping down and sitting on top of the 50-day SMA. For a stronger confirmation of an uptrend, you’d want to see the 21-day EMA stacked above the 50-day SMA, which it looks like it's starting to do.
- The ZigZag overlay clearly shows that the index is still in the midst of a series of lower highs. To break that pattern, it’ll have to clear the November 12 high. On the chart, you can see it's getting close.
So, on the surface, it looks like the S&P 500 is favoring the bulls, but it’s not quite there yet.
What’s Happening Beneath the Surface?
Looking at last week’s charts, it’s clear that overall market breadth is now showing signs of expanding. 63% of S&P 500 stocks are trading above their 20-day EMA, and 60% are trading above their 200-day SMA. Both of these statistics indicate that the overall market is strengthening.
Sentiment, though, is painting a different picture. The Cboe Options Equity Put/Call Ratio has climbed to 0.85, above the 0.75 threshold level that often signals rising caution. The NYSE McClellan Summation Index, meanwhile, is at -128.47. It turned up slightly after Tuesday’s close, but it’s still in negative territory. (Note: These charts get updated end-of-day.)
Thus, while breadth is bullish, sentiment is still bearish.
Nine of the 11 S&P 500 sectors closed in the green on Tuesday; the laggards were Utilities and Energy. Health Care was the leader, with Consumer Discretionary a close second. The Consumer Discretionary sector’s MarketCarpet from Tuesday doesn’t have a single red square.

Strong earnings from retailers such as Abercrombie & Fitch (ANF) and Kohl’s (KSS) probably helped fuel the Consumer Discretionary rally.
The strength in Health Care and Consumer Discretionary stocks also gave the small- and mid-cap groups a much-needed lift. The S&P 600 Small Cap Index ($SML) has broken above its short-term trendline.
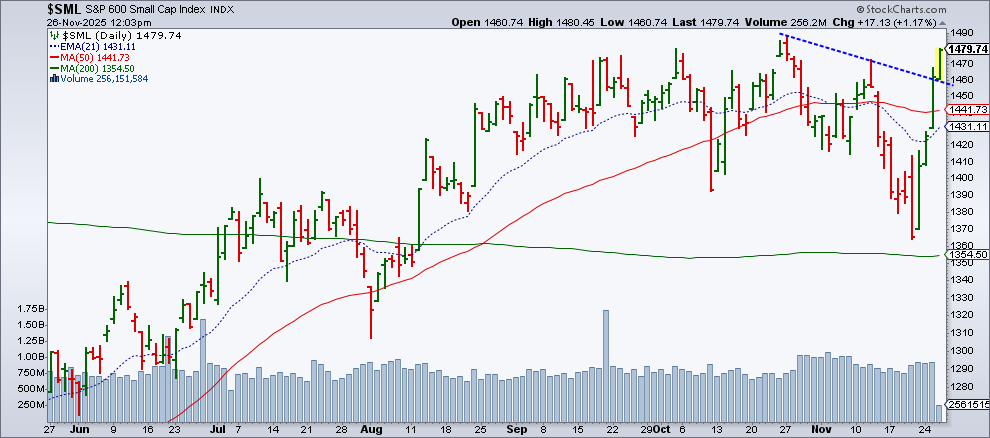
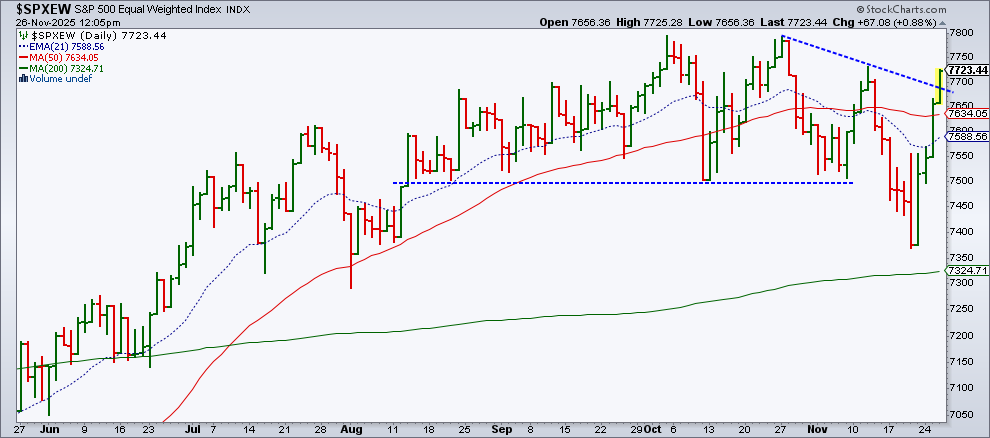
The S&P 400 Mid Cap Index ($MID) also follows a similar pattern. This suggests there is broader participation in the market. The S&P Equal Weighted Index ($SPXEW) has also broken above its short-term downward sloping trendline.
Then There’s the Fed
The odds of a 25-basis-point rate cut in the December FOMC meeting are now above 80%. This may have brought back the “risk-on” appetite, which is continuing into Wednesday. For now, the market seems optimistic, but keep an eye on the sentiment indicators, such as the Cboe Options Equity Put/Call Ratio and the NYSE McClellan Summation Index. It's worth saving those charts to your ChartLists, if you haven't done so already.
Best wishes for a happy Thanksgiving!
Disclaimer: This blog is for educational purposes only and should not be construed as financial advice. The ideas and strategies should never be used without first assessing your own personal and financial situation, or without consulting a financial professional.


