Stocks Steady, Small Caps Lead, Gold Surges: What the Charts Are Really Saying?
Key Takeaways
- The broader market trend remains bullish, but leadership is rotating rather than accelerating.
- Small-cap strength points to confidence in the U.S. economy, which could help support the next leg higher.
- Gold and silver hitting new highs suggest investors are staying cautious, even as stocks hold up.
Did you feel a little whiplash from this week’s headlines? You weren’t alone. Tariff concerns briefly took center stage and shook the stock market, but they faded quickly. While that news caused a short-term wobble in the charts, it didn’t change the bigger story.
That bigger story for 2026, so far, has been rotation, as we continue to see money move out of the popular leaders and into other areas of the market. However, it’s nothing to worry about. In fact, it’s a healthy sign that the bull market is still intact.
S&P 500 Holding Ground, But Isn’t In a Hurry
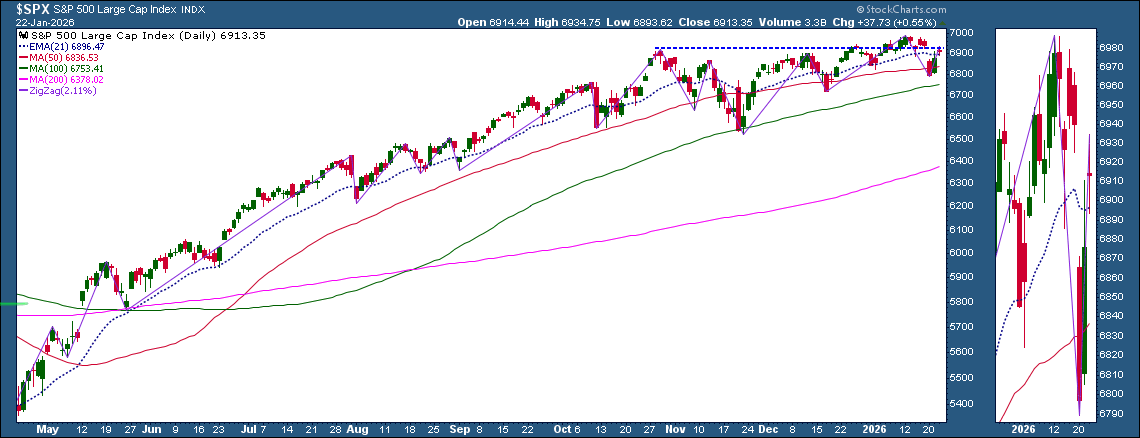
The S&P 500 ($SPX) bounced back after Tuesday’s selloff, although it doesn’t seem to be in a rush to notch a new all-time high. This isn’t necessarily a negative factor, though.
Let’s analyze the daily chart of the S&P 500. Can the index close above 6,925 to close Monday’s gap? This is an important short-term key resistance area, one which also aligns with the October high. Although the S&P 500 is holding above its 21-day Exponential Moving Average (EMA), we’d like to see a decisive breakout and solid follow-through to confirm the continuation in the uptrend.
Key levels to watch
Resistance
- 6,925 (gap fill/October high)
- 6,986 (January 12 high)
- 7,000 (a major, round psychological number)
The next resistance level would be the January 12 high of 6986. Beyond that, the next level to watch would be 7000.
Support
- Around the 6,790 level (January 20 low)
- 6,720 (December 17 low)
- Further downside would be a sign of a weakening uptrend
The ZigZag overlay on the chart helps highlight turning points by filtering out the smaller moves. This is especially useful when markets are moving sideways.
Learn how to use the ZigZag overlay to identify trend changes.
Tech Earnings On Deck
Earnings season continues with tech stocks in focus. Intel (INTC) reported after Thursday’s close; while the company reported better than expected earnings, investors zeroed in on the softer forward guidance. The stock price hit 52-week highs during the regular trading session but fell in after-hours trading.
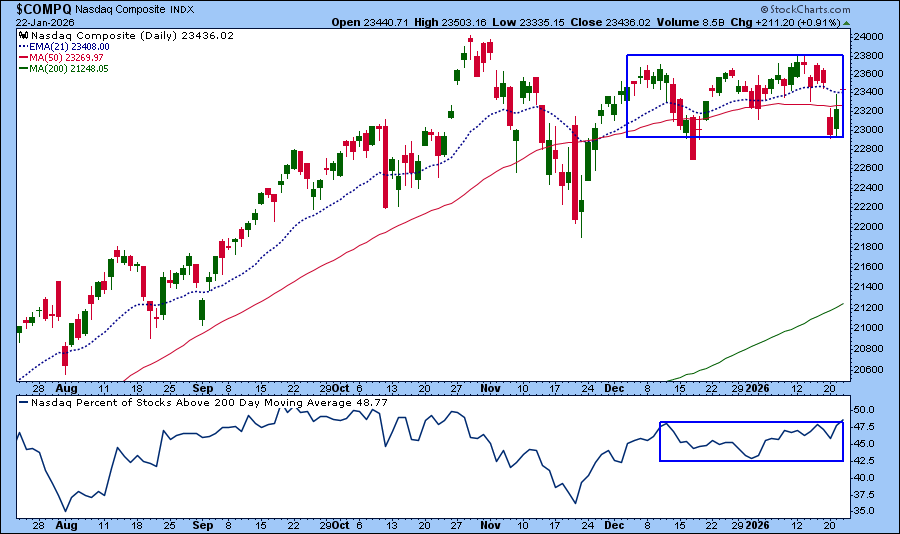
More major tech earnings are coming next week, which could set the tone for the sector. Tech stock performance has been mixed. Stocks of Micron Technology (MU), ASML Holding (ASML), and Taiwan Semiconductor Mfg (TSM) have been climbing higher, but the Magnificent Seven have stalled. The chart of the Nasdaq Composite ($COMPQ) reflects this mixed performance. The index has moved sideways since early December, and so has the percentage of Nasdaq stocks trading above their 200-day moving average, a measure of market participation.
Trend is Still Bullish, Volatility is Still Calm
Overall, the broader indexes are still holding their bullish trends. We’re not seeing signs of any meaningful deterioration just yet. Volatility has also cooled off, with the Cboe Volatility Index ($VIX) hovering around 15. This indicates that investors are relatively comfortable.
One of the more notable shifts has been investor preferences. The S&P 600 Small-Cap Index ($SML) is trading at an all-time high and, over the past year, the iShares Russell 2000 ETF (IWM) has outperformed the SPDR S&P 500 ETF (SPY) (see chart below).
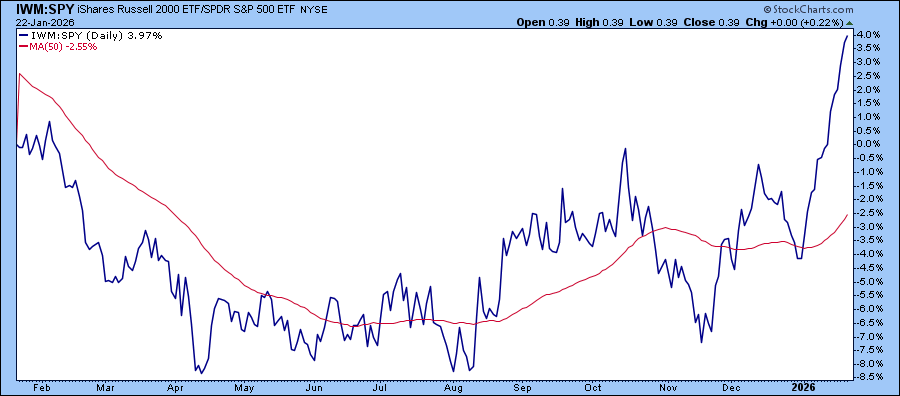
When small caps participate in the rally, it often signals confidence in the U.S. domestic economy. Smaller companies tend to be more economically sensitive, so their leadership can act as fuel for the broader market.
What About Gold and Silver?
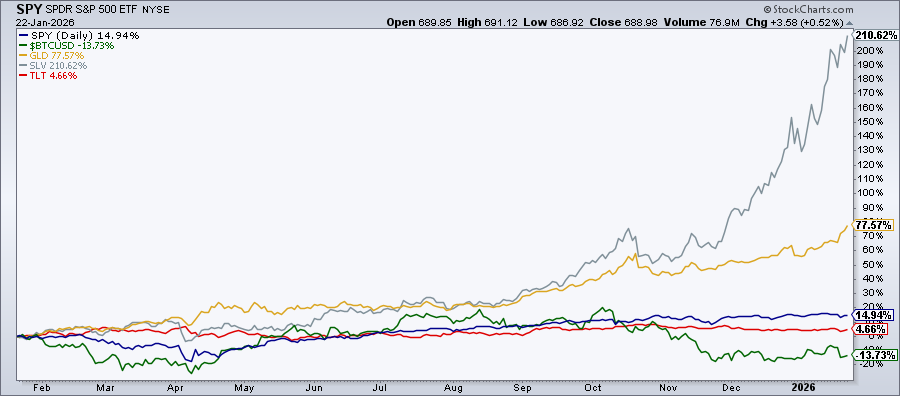
What’s more interesting is that while stocks hold on to their bullish trend, gold and silver prices continue to surge. Spot gold ($GOLD) closed at $4,956.92 per ounce and spot silver ($SILVER) closed at $96.82. Both are nearing important psychological levels, namely $5,000 for gold and $100 for silver. Over the last year, both metals are outperforming most other asset classes by a wide margin.
What Does This Tell Us?
While investors are participating in the stock market, they’re also keeping one foot planted in defensive assets. Gold and silver often act as hedges during periods of uncertainty and their strength could indicate that investors aren’t letting their guard down. This is something to watch in the next few weeks.
As always, let the charts be your guide.
Disclaimer: This blog is for educational purposes only and should not be construed as financial advice. The ideas and strategies should never be used without first assessing your own personal and financial situation, or without consulting a financial professional.


