Tariff Relief Rally? Why Retail Charts Tell a Mixed Story

Key Takeaways
- Retail stocks inched up after the SCOTUS IEEPA tariff ruling, but equity gains appeared partly priced in.
- Q4 earnings reactions may determine whether recent rebounds can gain traction.
- Mixed chart patterns highlight key support, resistance, and big congestion zones.
Amid a blizzard of macro noise, NVIDIA (NVDA) earnings is the most-anticipated single-stock event this week. Whether the world’s most valuable company smashes top- and bottom-line estimates will, of course, be in focus, along with key AI comments from CEO Jensen Huang. At the very least, it gives investors a pit stop off the tariff track. For now, stocks and bonds have taken the Supreme Court’s ruling against President Trump’s IEEPA import duties in stride, along with the 10%—now 15%—Section 122 levy.
Tariff refunds are now on the table, and that could be materially beneficial for retailers with heavy domestic footprints. Within the Consumer Discretionary sector, it’s a double play of volatility catalysts, with quarterly results from the likes of Nike (NKE), lululemon (LULU), Williams-Sonoma (WSM), and RH (RH) due over the coming weeks, along with all the tariff noise.
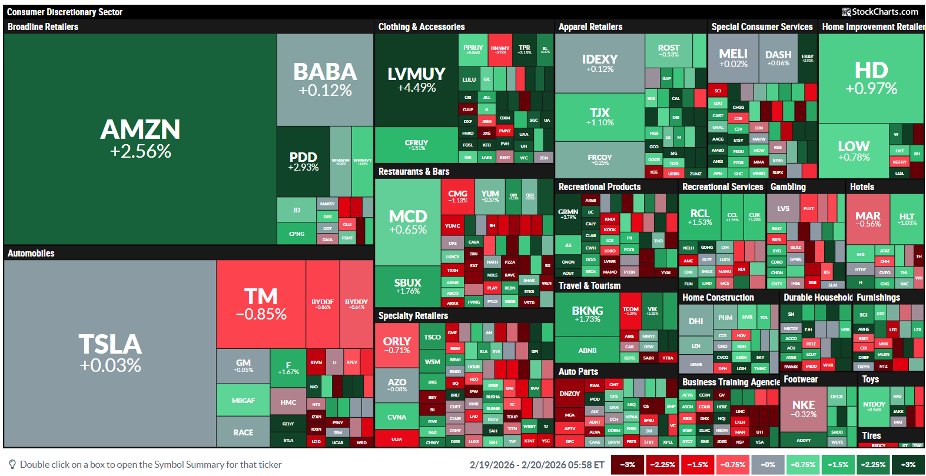
The trade war hit these stocks the hardest. Naturally, they were some of the biggest winners in the seconds after the landmark case’s decision at 10 a.m. ET last Friday. But what do the charts say about these smaller retailers?
To set the stage, recall that last week, Walmart (WMT) reported solid revenue and earnings. Shares sold off leading into and after the print, positive tariff news notwithstanding. Now below a trillion-dollar market cap, WMT endured its worst week since May 2022.
So, let’s go on a technical shopping spree with several household brand-name retail plays and let the macro talking heads debate tariffs and whatever the president announces Tuesday night at the State of the Union.
NKE, LULU, WSM, RH Fighting Their Own Battles
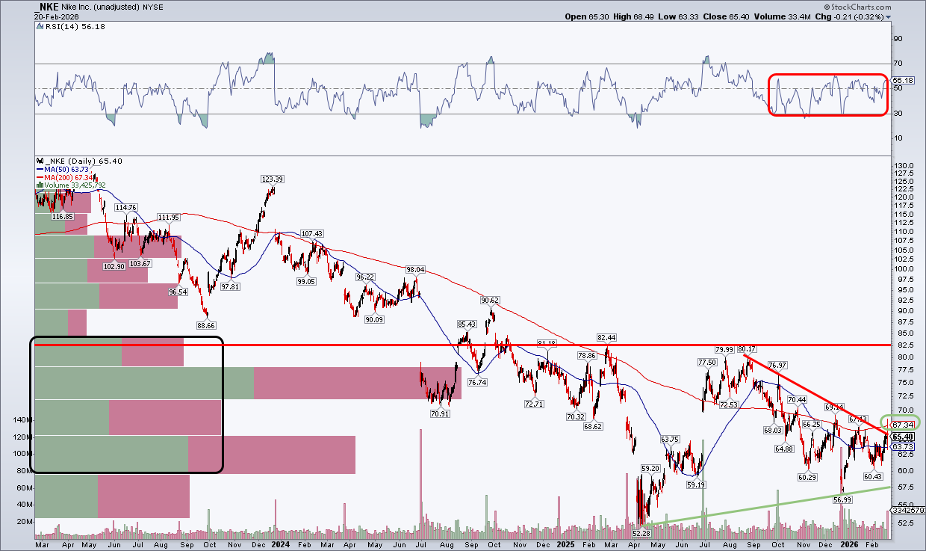
Hitting the ground running, Nike shares just aren’t doing it for the bulls. Notice in the chart below that the $97 billion-market-cap Discretionary stock has been a chronic underperformer. While NKE bottomed in April 2025, it is closer to its 52-week low than its 52-week high. What’s more, the RSI momentum oscillator at the top of the chart has been in a somewhat bearish range between 25 and 60. Long-term resistance is more than 20% above the current price, just above $80.
But now take a look at the long-term 200-day moving average. It’s on the rise, and shares poked above it at the high last Friday. A close above the 200-dma is the bogey here, just as a near-term downtrend line may be breaking in the bulls’ favor. Nike reports its fiscal Q3 results on Thursday, March 19.
Lululemon: Stretching Toward Resistance
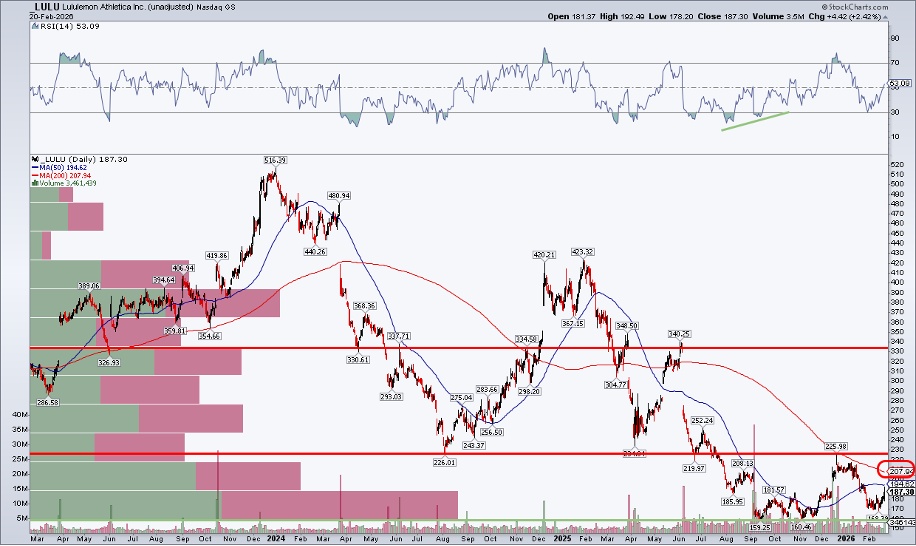
Next on my nixed-tariff beneficiary list is lululemon. Extended to the downside, LULU bears are in good shape. Like with NKE, though, the bulls may be about to stretch their legs if key technical levels are reached. My preferred SharpCharts view is a three-year zoom, with the 50-dma and 200-dma plotted. The 14-period Relative Strength Index (RSI) is at the top, while the volume-by-price profile is on the left. Candlesticks are my friend, with it being very easy to spot critical gaps and intraday highs/lows through them. LULU has obvious support close to $160, with $225 as resistance.
Unlike NKE, LULU's declining 200-dma puts the bears in charge, with price also below that trend-indicator line. A mildly bullish RSI divergence to price occurred in Q4 2025, but the stock was rejected precisely at the 200-dma late in the year. A rally through the 200-dma is step one. Step two is hurdling the $226 level, which would trigger a measured-move price target to about $290 based on the height of the current range. LULU reports a week after NKE.
Williams-Sonoma: A Pattern Worth Decorating
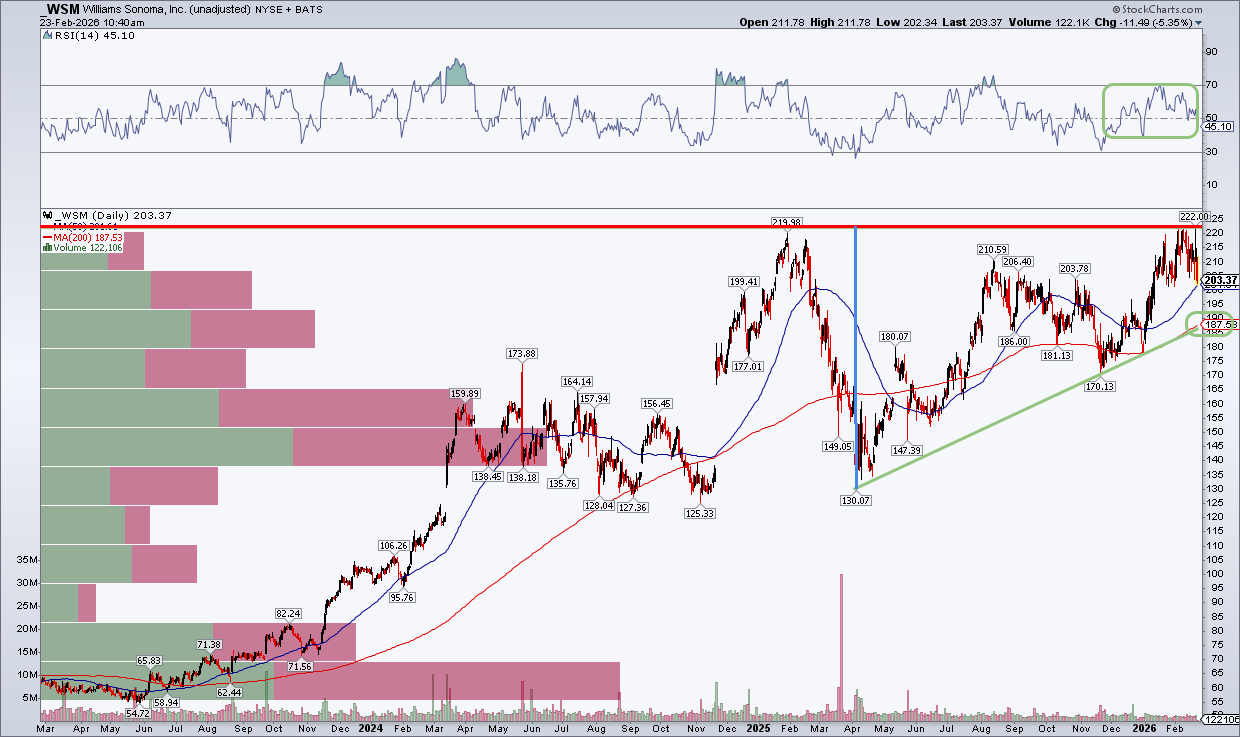
Now onto my final two tariff troublemakers: WSM and RH. The former warrants a bullish view, with price largely moving from bottom-left to top-right. Additionally, a constructive ascending triangle pattern is in play for shares of the home furnishings retailer. Based on the depth of the decline from a year ago and a presumed breakout above $220 resistance, a measured-move upside objective to $310 cannot be ruled out.
$185–$190 is clear support — the confluence of the rising 200dma and uptrend line from so-called “Liberation Day” 2025. The RSI is in a decent zone, while the volume profile asserts clear skies above. If you prefer to hang out around the goal line, this is one retail-tariff play for you. WSM decorates the earnings tape on Wednesday, March 18.
RH: Volatility in the Showroom
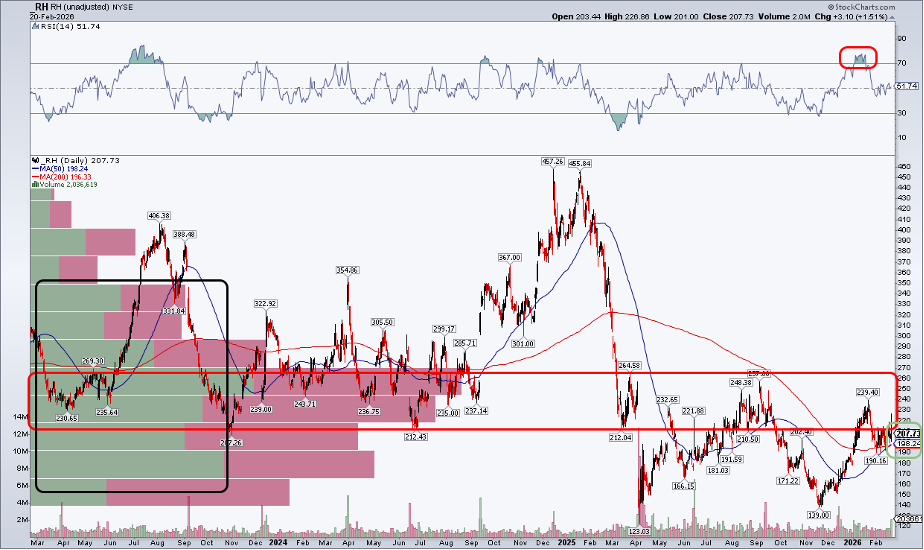
Finally, who can forget that infamous Q4 2024 earnings call just as tariff turmoil set in? This is the messiest chart of them all. A broad battle zone from $210 to $270 has made for ugly price action and protracted underperformance relative to the S&P 500. With just a $4 billion market cap and extremely high 18% short interest, I expect volatility to be highest in RH among the four.
The stock hugs the flat 200-dma and rising 50-dma as all the tariff noise comes through. Shares printed a lower high earlier this year while tagging technical overbought conditions. Furthermore, significant congestion is in play up to the 52-week high. The bulls must defend a small gap near $180. Earnings are slated for April Fool’s Day, and it could be another jaw-dropping conference call. Stay tuned.
The Bottom Line
Tariff reactions were initially bullish last Friday morning, but investors appeared to have mostly priced in the likelihood that SCOTUS would strike down President Trump’s IEEPA tariffs. New duties are in play, but volatility (so far) is light. Within retail, there are mixed stories. Q4 reports are on tap, and price action will be the ultimate arbiter of trade policy.